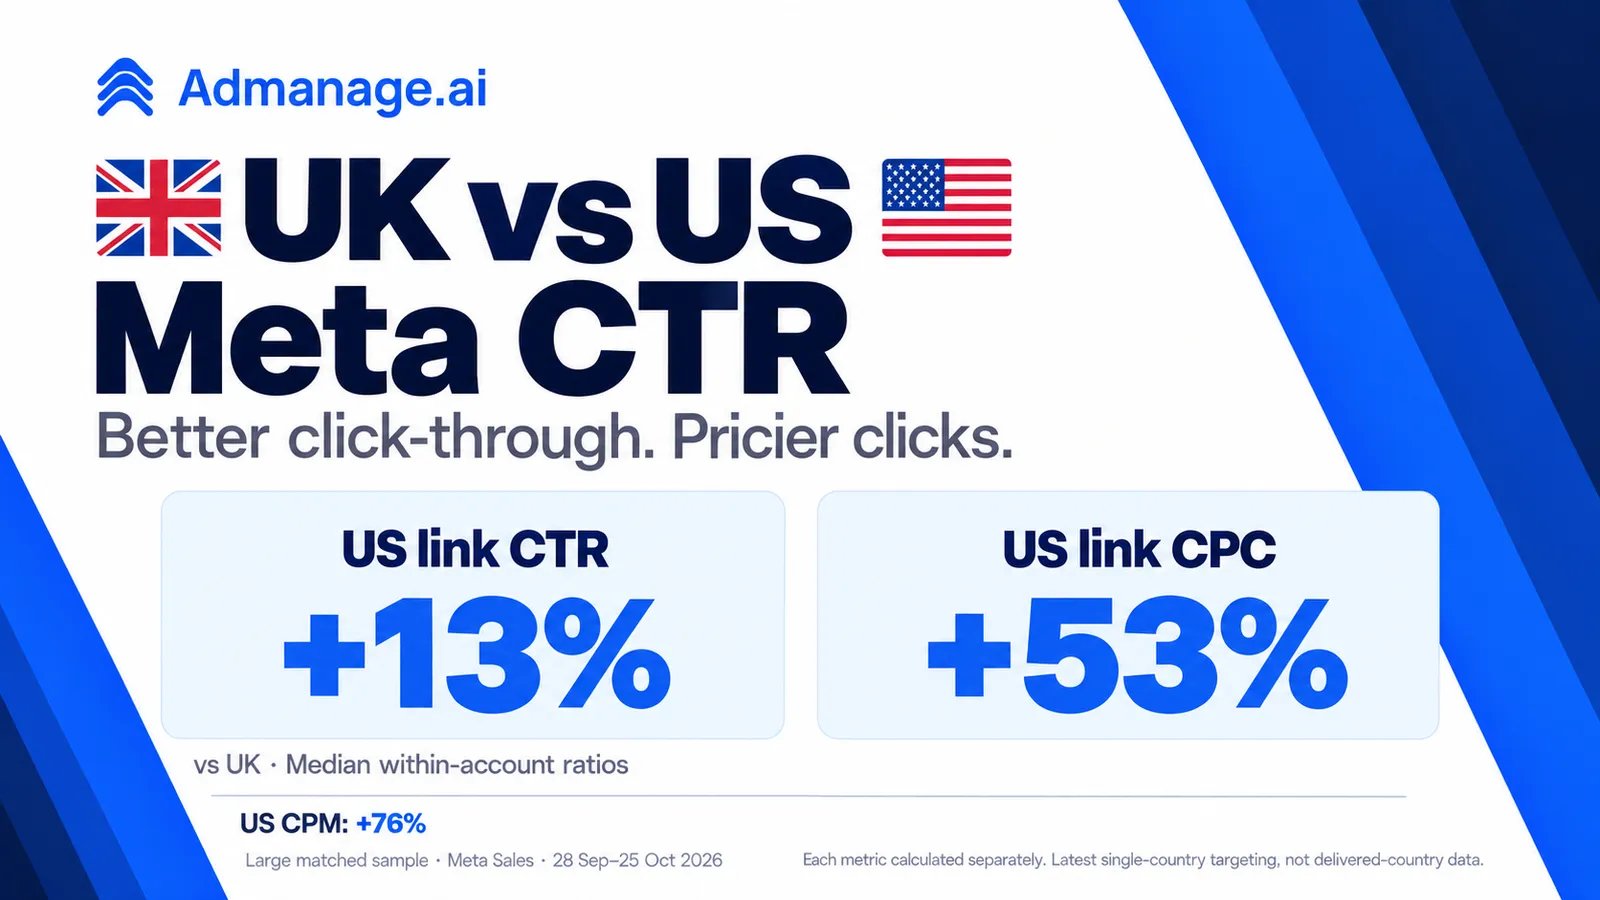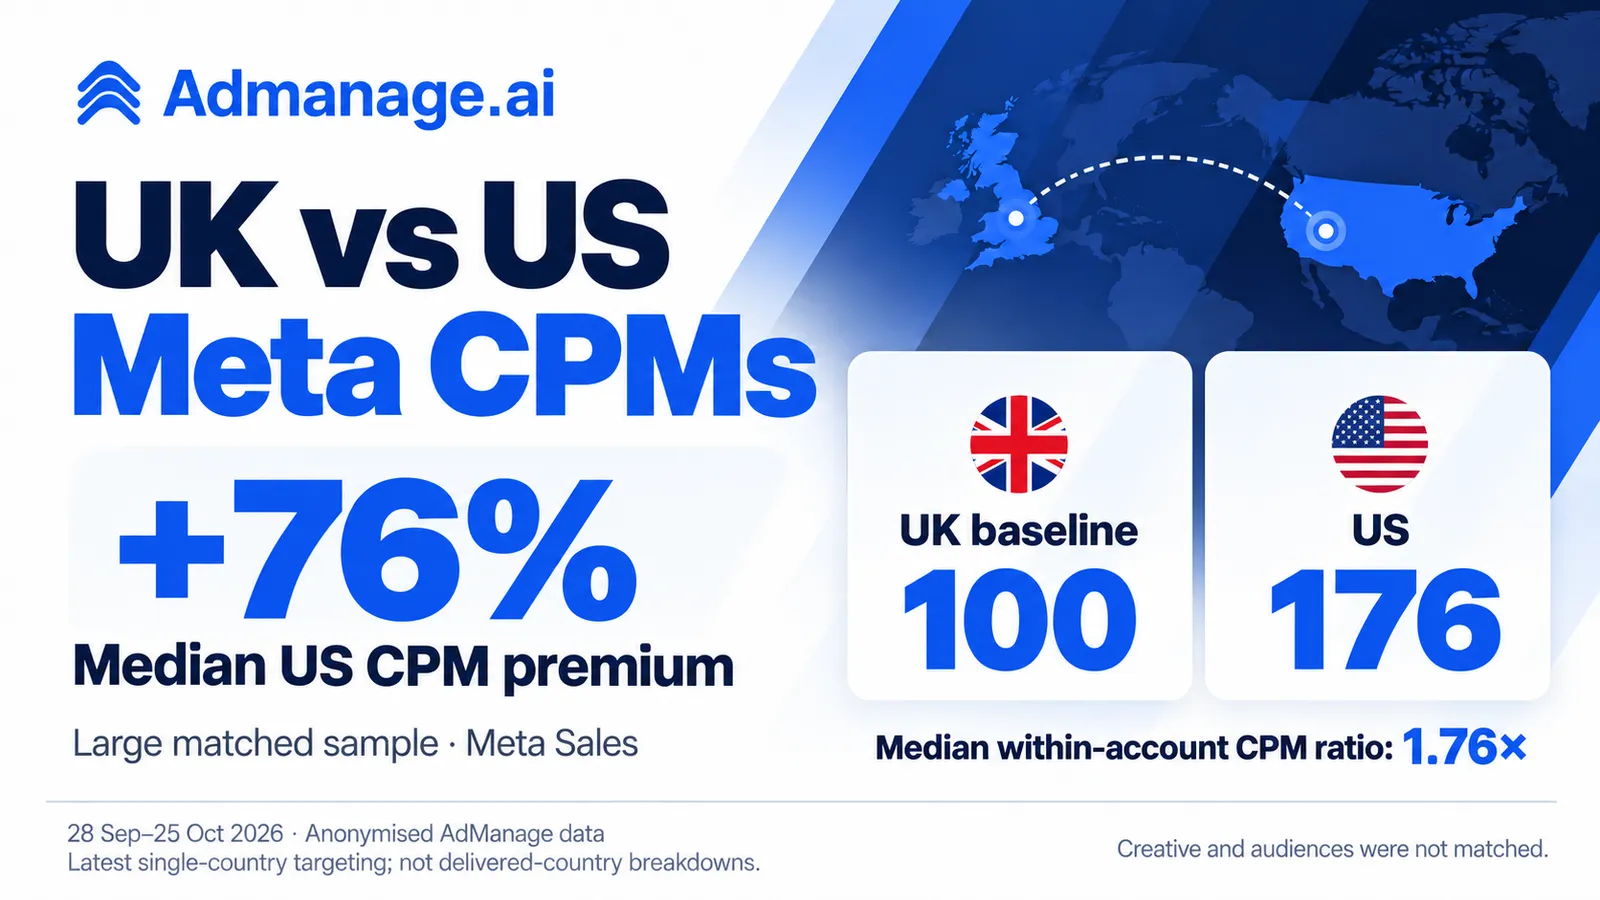

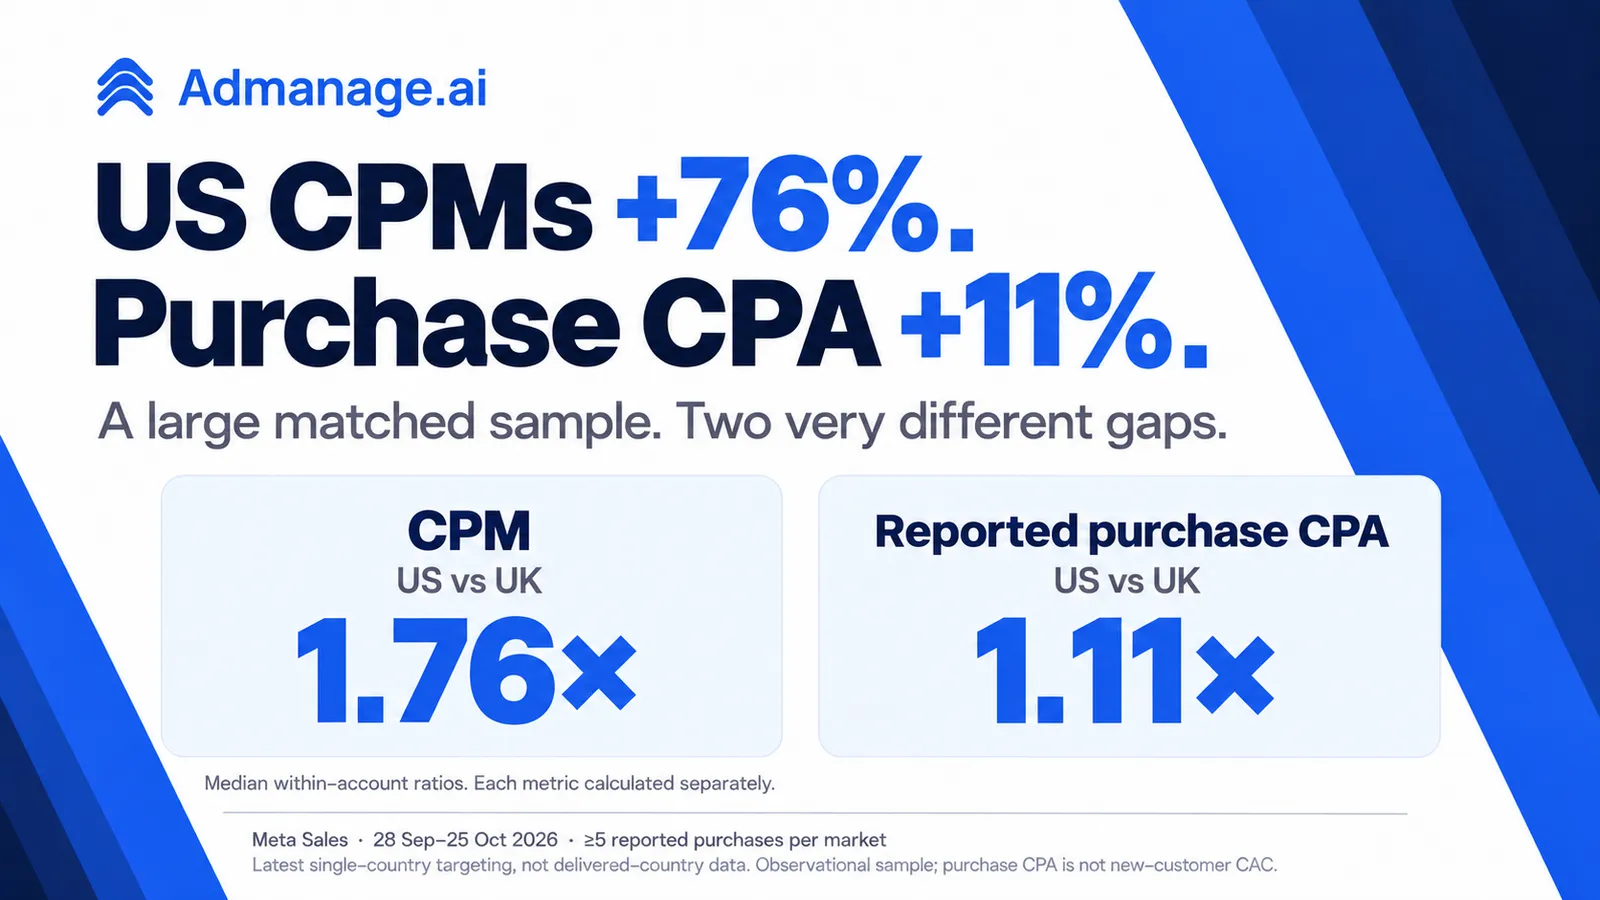
US Meta impressions cost considerably more in our latest UK–US sample. Reported purchases did not become more expensive by the same proportion.
Across a large matched sample with qualifying Sales activity targeting both markets, the median within-account US/UK CPM ratio was 1.76×, while the median within-account reported purchase CPA ratio was 1.11×. That is approximately a 76% CPM premium and an 11% purchase CPA premium, calculated separately across the same accounts.
These are observational benchmarks from 28 September to 25 October 2026, queried from AdManage’s BigQuery data on 28 October. Geography uses the latest strict single-country ad-set targeting, not delivered-country reporting. The results describe this sample and period; they do not establish that entering the US causes an 11% CPA increase.
What do we mean by purchase CPA?
Purchase CPA is advertising spend divided by the number of purchases reported in Meta’s purchase action fields. An account spending $3,000 and reporting 60 purchases has a purchase CPA of $50.
It is a specific outcome metric. A lead, a registration and a purchase should not share a generic CPA benchmark. This article uses reported purchases only, within Meta Sales activity, rather than treating every campaign result as equivalent.
It also differs from new-customer acquisition cost. Meta’s reported purchases can include repeat customers, and this extract does not identify whether each transaction came from a first-time buyer. It does not include the full cost of staff, creative production or other acquisition channels. Use your order system and customer records to calculate new-customer CAC and contribution margin.
The matched-account UK–US comparison
For each qualifying account, we first calculated its US and UK metrics separately. We then divided that account’s US purchase CPA by its UK purchase CPA. Finally, we took the median of those account-level ratios. Each account therefore contributes one ratio, irrespective of its budget.
We calculated CPM ratios separately for exactly the same large matched sample. This avoids comparing one group’s CPM with another group’s purchase CPA.
| Metric | Median US/UK ratio | Middle 50% of account ratios |
|---|---|---|
| CPM | 1.76× | 1.43×–2.18× |
| Reported purchase CPA | 1.11× | 0.79×–1.46× |
The purchase CPA spread matters. The lower quartile was below 1.00×, meaning a meaningful portion of the sample reported a lower US purchase CPA than UK purchase CPA. Other accounts paid substantially more. A median is a useful reference point, not a forecast for an individual launch.
The median US purchase CPA within this matched cohort was approximately $75, and the median UK purchase CPA was approximately $62. Dividing those two medians produces a different result from the median of the individual accounts’ ratios. The 11% headline comes from within-account ratios, not the ratio of those two country medians.
Does the result survive stricter filters?
Purchase measurement can change with attribution settings and low conversion counts. We therefore checked whether the direction remained similar under alternative sample definitions.
| Sample definition | Median US/UK CPM ratio | Median US/UK purchase CPA ratio |
|---|---|---|
| Primary purchase-tracking Sales cohort | 1.76× | 1.11× |
| At least 20 reported purchases in each market | 1.76× | 1.15× |
| Only attribution-setting categories present in both markets within each account | 1.76× | 1.11× |
| DTC ecommerce accounts only | 1.81× | 1.11× |
| DTC ecommerce with common attribution-setting categories | 1.77× | 1.10× |
The higher purchase threshold increases the median CPA premium from about 11% to about 15%. Restricting each account to attribution-setting categories found in both markets leaves the broad result close to the primary estimate. These checks make the finding more useful, but they do not remove every measurement difference.
In the common-attribution check, we keep only non-missing setting categories observed on both sides of an account, reaggregate the remaining activity and reapply the spend, impression and purchase floors. Accounts can still have a different mix of ad sets or spend within those categories. This is a sensitivity check, not a randomized experiment or a guarantee of fully comparable attribution.
UK vs US purchase CPA by industry
For practical planning, the table below uses accounts classified as DTC ecommerce. Each country’s median is calculated across its own eligible accounts. These are separate country cohorts, so the differences between the columns must not be described as matched-account US premiums.
All monetary values are in USD, including the UK column, using AdManage’s fixed reporting conversion rates. Values are rounded to the nearest dollar. The middle 50% runs from the 25th to the 75th percentile of account CPAs; it is not a confidence interval.
| Industry | UK median CPA | UK middle 50% | US median CPA | US middle 50% |
|---|---|---|---|---|
| Apparel & Accessories | $52 | $31–$91 | $71 | $43–$116 |
| Health & Wellness | $94 | $53–$140 | $95 | $66–$160 |
| Beauty & Personal Care | $38 | $26–$56 | $65 | $42–$113 |
| Home & Garden | $62 | $36–$117 | $87 | $51–$150 |
| Food & Beverage | $60 | $34–$82 | $76 | $44–$120 |
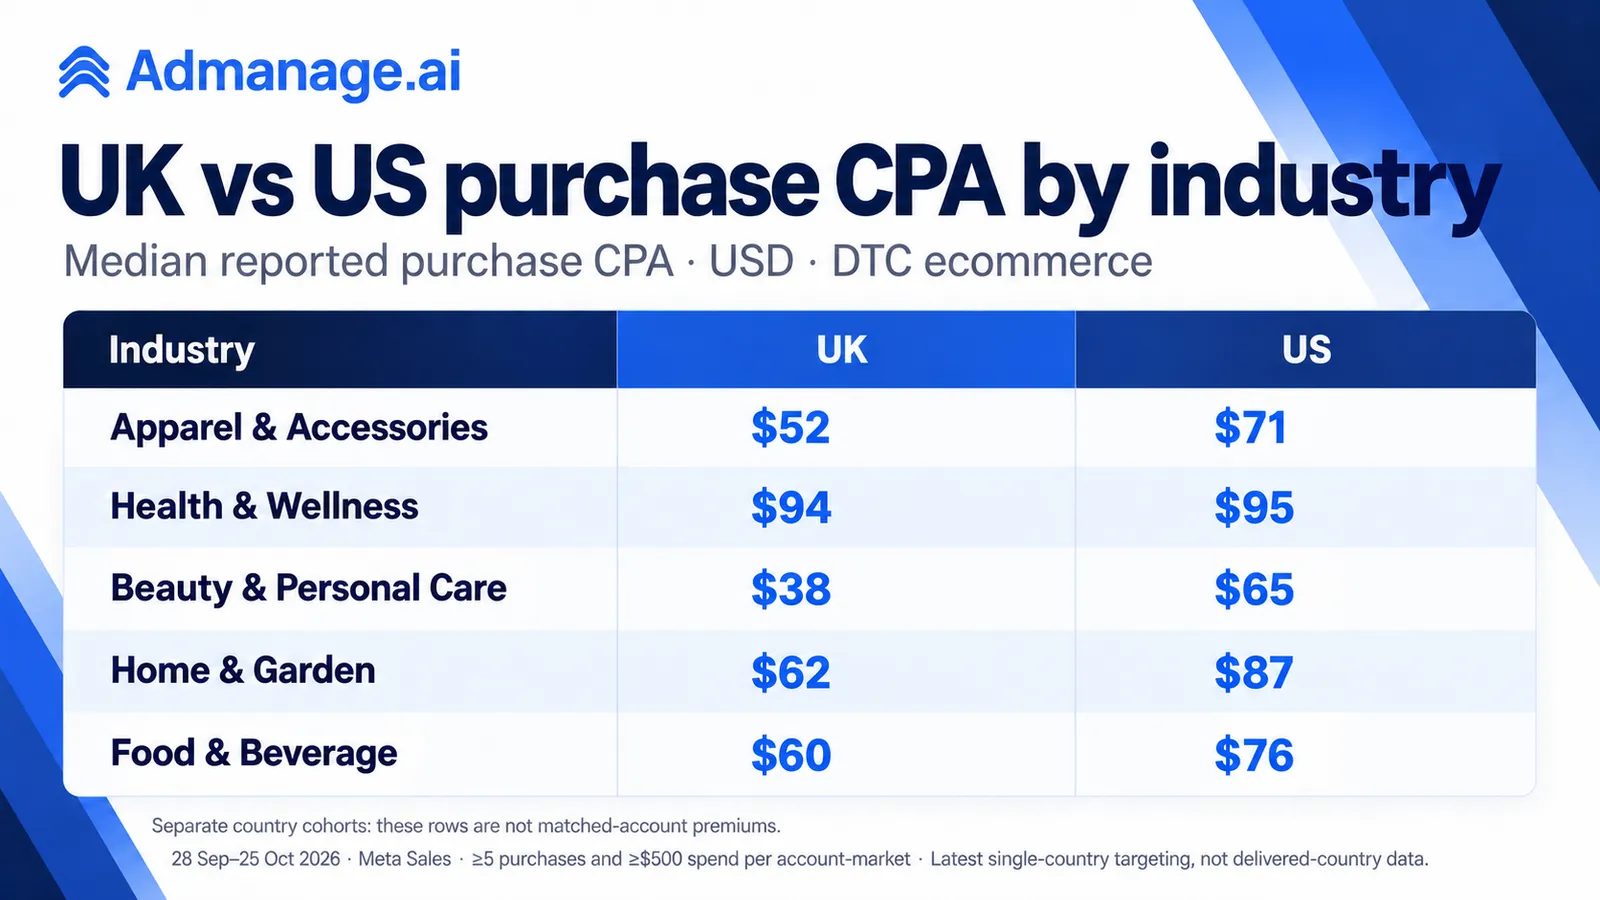
Across all eligible DTC ecommerce accounts, the separate-country median was approximately $54 in the UK and $77 in the US. This broader snapshot contains many accounts that appear in only one market, which is why it should not replace the matched-account analysis.
Apparel and accessories: a large CPM gap, a smaller purchase CPA gap
The broader apparel table shows a $52 UK median and a $71 US median. A separate analysis of the matched apparel sample qualifying in both markets found a median within-account CPM ratio of 2.02×, compared with a purchase CPA ratio of 1.15×.
That is roughly a 102% CPM premium alongside a 15% reported purchase CPA premium in this matched apparel sample. The middle half of purchase CPA ratios ranged from approximately 0.81× to 1.49×, so an individual brand could sit well away from the median.
An apparel team expanding into the US should therefore measure the entire path from impression to profitable order. Treating twice the CPM as proof that purchase economics must also be twice as expensive would miss what happened in this sample. It would also be a mistake to assume the 15% median will apply to every clothing brand.
Health and wellness: similar broader medians need context
The broader DTC health and wellness medians were close: $94 for the UK and $95 for the US. That alone does not show that the same advertisers obtained nearly identical results.
The qualifying matched health and wellness sample had a median US/UK purchase CPA ratio of 1.03×, alongside a CPM ratio of 1.62×. This matched industry cohort is relatively small. Use it as a directional reference and pay attention to its limited sample size.
Product price, subscriptions, repeat purchasing and attribution can all affect reported purchase CPA. The extract does not isolate these mechanisms, so it cannot tell us which one explains a particular industry’s result.
Beauty, home and food: use the ranges, not a universal target
Beauty and personal care had broader medians of $38 UK and $65 US. Home and garden had $62 UK and $87 US. Food and beverage had $60 UK and $76 US. These are useful starting references for comparing similar outcome types, with the country cohort distinction preserved.
We do not publish matched UK–US ratios for these three industries because their paired samples fail our sample-size or spend-concentration thresholds. The public country medians each pass those checks. A missing matched estimate is a data limitation, not evidence that the market difference is zero.
Why purchase CPA need not move in proportion to CPM
At the level of an individual account and market, the arithmetic is:
Purchase CPA = CPM ÷ (1,000 × reported purchases per impression).
If the cost of buying impressions rises but the number of reported purchases generated per impression also rises, CPA can increase by less than CPM. The purchase measure is an attributed outcome count, so “purchases per impression” should not be interpreted as a clean experimental conversion probability.
We observed a median US/UK reported-purchases-per-impression ratio of approximately 1.62× across the primary large matched sample. That supports the arithmetic explanation for a smaller purchase CPA gap. It does not establish why performance differed, and it cannot be combined with the median CPM ratio to reconstruct the median CPA ratio: medians of ratios do not generally multiply or divide that way.
Creative relevance, traffic mix, conversion behaviour, remarketing share and measurement differences are possible contributors. This dataset does not separately identify their causal effects. It also does not tell us whether the US orders had better margins, more first-time customers or stronger repeat value.
A $3,000 expansion example
Consider the following synthetic illustration, not an observed customer or a forecast. Both markets spend $3,000. The UK buys impressions at a $15 CPM, while the US pays $27.
| Illustrative metric | UK | US |
|---|---|---|
| Spend | $3,000 | $3,000 |
| CPM | $15 | $27 |
| Impressions | 200,000 | Approximately 111,111 |
| Reported purchases | 60 | 55 |
| Reported purchase CPA | $50.00 | $54.55 |
Here the US CPM is 80% higher, while purchase CPA is about 9% higher. The US generates fewer impressions but more reported purchases per impression. This illustrates how the metrics can move differently; it does not reproduce the sample’s median advertiser.
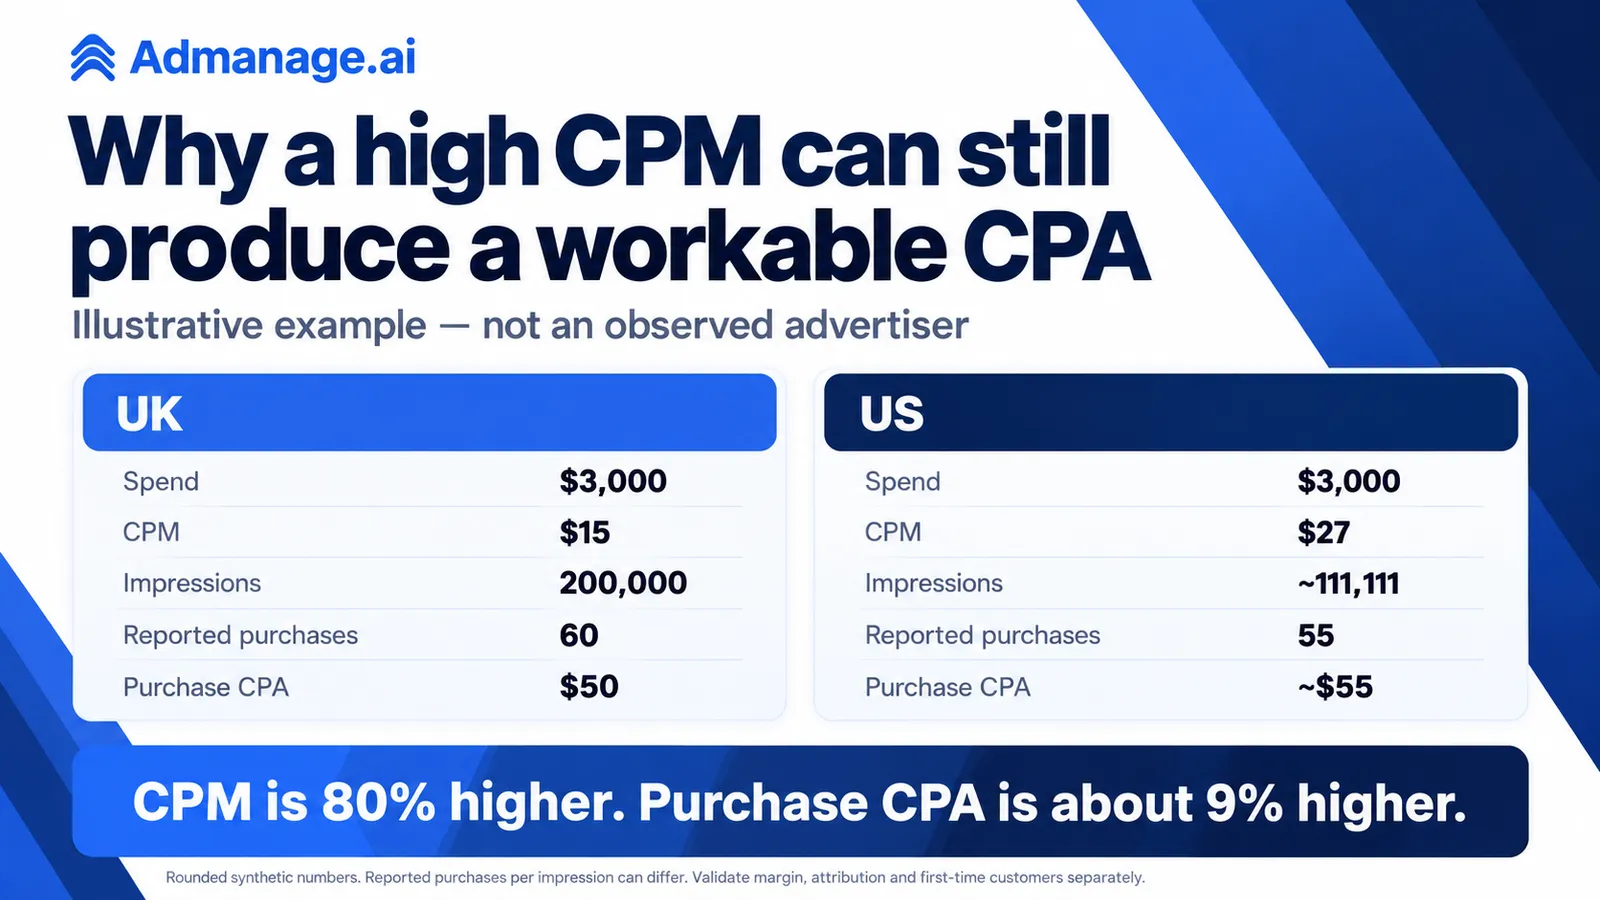
Now bring in the economics. If the maximum sustainable advertising cost per order were $60 in both markets, both illustrative outcomes would sit below that threshold. If US fulfilment, duties and returns reduced the sustainable threshold to $45, the US result would exceed it despite its CPA being close to the UK’s. These $60 and $45 thresholds are assumptions for the example, not benchmarks from the data.
The right expansion decision therefore combines measured acquisition cost with the contribution left after the costs relevant to that market. Compare first-time customer economics separately from blended reported purchases, especially when your UK audience is already familiar with the brand.
How to design a useful UK-to-US test
Start with an explicit outcome. If the question is acquiring new customers profitably, define the first-order contribution or CAC threshold using your own customer and order records. Keep Meta’s reported purchase CPA as a diagnostic alongside it.
- Record the baseline. Use a recent UK period with a consistent attribution setting and document spend, purchases, first-time customers, revenue and contribution. Preserve the dates so seasonal changes are visible.
- Separate markets in reporting. Keep US and UK activity distinguishable, with comparable Sales objectives and a clear prospecting-versus-existing-customer split where available. Avoid combining a mature UK remarketing programme with a new US prospecting test and calling it a country effect.
- Set an affordable learning budget. Work backwards from an assumed CPA and the number of purchases needed to make the result interpretable. For example, 20 reported purchases at an assumed $75 CPA imply $1,500 of spend. That arithmetic is a planning scenario, not a requirement from Meta or a guarantee of sufficient statistical power.
- Track the whole funnel. Compare CPM, link CTR, landing-page behaviour, purchase CPA and first-time customer outcomes. A higher CPM can be offset downstream, while a low purchase CPA can still conceal weak margins or repeat-customer attribution.
- Choose a review rule before launch. Define a spend cap, the minimum observation period and the economic threshold that would trigger a change. Avoid judging a handful of purchases against a precise industry median.
For the impression-cost side of the test, see our UK vs US Meta CPM benchmarks. For a broader process, use the creative testing budget guide and Meta ads for ecommerce guide.
Methodology and limitations
Source and period. Read-only BigQuery queries of AdManage-connected Meta reporting data, covering 28 September–25 October 2026 inclusive, queried on 28 October. Candidate accounts came from the existing UK–US Sales research extract; this is not a census of all Meta advertisers.
Geography. We join reporting activity to the latest deduplicated ad-set targeting record. We require exactly one included country, US or GB, and exclude additive regions, cities, ZIPs, custom locations, geo markets, country groups and location clusters. Geography is targeting-based, not a delivered-country breakdown. Because the targeting record is the latest state, targeting changes during the reporting window can affect interpretation.
Outcome and eligibility. We use the Sales objective and require at least $500 equivalent spend, 1,000 impressions and five reported purchases in each included account-market. We exclude internal accounts, unsupported currency conversions and account-markets with reported purchase ROAS above 30 to limit extreme tracking artefacts. Zero-purchase and fewer-than-five-purchase markets are excluded, so these benchmarks underrepresent failed or very early tests.
Purchase extraction. For each source row, we take the first non-null purchase action sum in this priority order: omni_purchase, offsite_conversion.fb_pixel_purchase, onsite_conversion.purchase, purchase. We do not add those overlapping aliases together. We apply the equivalent rule to purchase values used for the ROAS filter. Reported actions can still contain platform attribution and tracking limitations; we have not independently reconciled them to merchant orders.
Aggregation. Spend and purchases are summed within each account-market before calculating CPA. Country and industry tables are medians of account CPAs, not pooled spend divided by pooled purchases. Matched estimates are medians of each account’s US/UK ratio. The sensitivity samples reapply eligibility after their restrictions.
Currency. Monetary comparisons use fixed AdManage reporting rates into USD, rather than historical daily FX. Ratios within a single account use the same currency conversion on both sides, so that conversion cancels from the ratio.
Industry labels and privacy. Industry and business-model classifications are inferred and can be wrong. We publish an aggregate only when it meets a minimum contributor threshold and no account contributes more than 40% of its spend. For paired aggregates, both markets must pass. Public files contain only aggregate results, never customer names or account IDs.
Interpretation. The analysis is observational. Accounts, products, creative, budgets, customer familiarity and attribution mix can differ by market. It estimates neither incrementality nor the causal impact of launching in the US, and reported purchase CPA is not first-time customer CAC.
Frequently asked questions
How much more expensive is US Meta purchase CPA than UK CPA?
In this large matched sample, the median within-account US/UK reported purchase CPA ratio was 1.11×, or approximately 11% higher. The middle half ranged from 0.79× to 1.46×. This is not a universal market markup or a prediction for a new advertiser.
Why does the US CPM premium look much larger than the CPA premium?
CPM measures impression cost. Purchase CPA also depends on the reported purchases generated from those impressions. The same large matched sample had a median CPM ratio of 1.76× and a median purchase CPA ratio of 1.11×. Differences in outcomes and attribution can contribute; this extract does not prove a causal explanation.
Can I compare these CPA figures with my lead-generation campaign?
Use a benchmark with the same outcome. These figures describe reported purchases in Meta Sales activity, with the industry table restricted to DTC ecommerce. A cost per lead or registration answers a different question.
Should I use an industry median as my target CPA?
Use your sustainable contribution margin and first-time customer economics to set the target. Industry medians and ranges help you interpret a test, but cannot account for your prices, fulfilment costs, margins, customer mix or attribution.
For the impression-to-click step, see our UK versus US Meta CTR analysis, including five industry comparisons and worked traffic-cost examples.