
US Meta ads earned a higher link click-through rate than UK ads in our latest matched comparison. Their clicks still cost more.
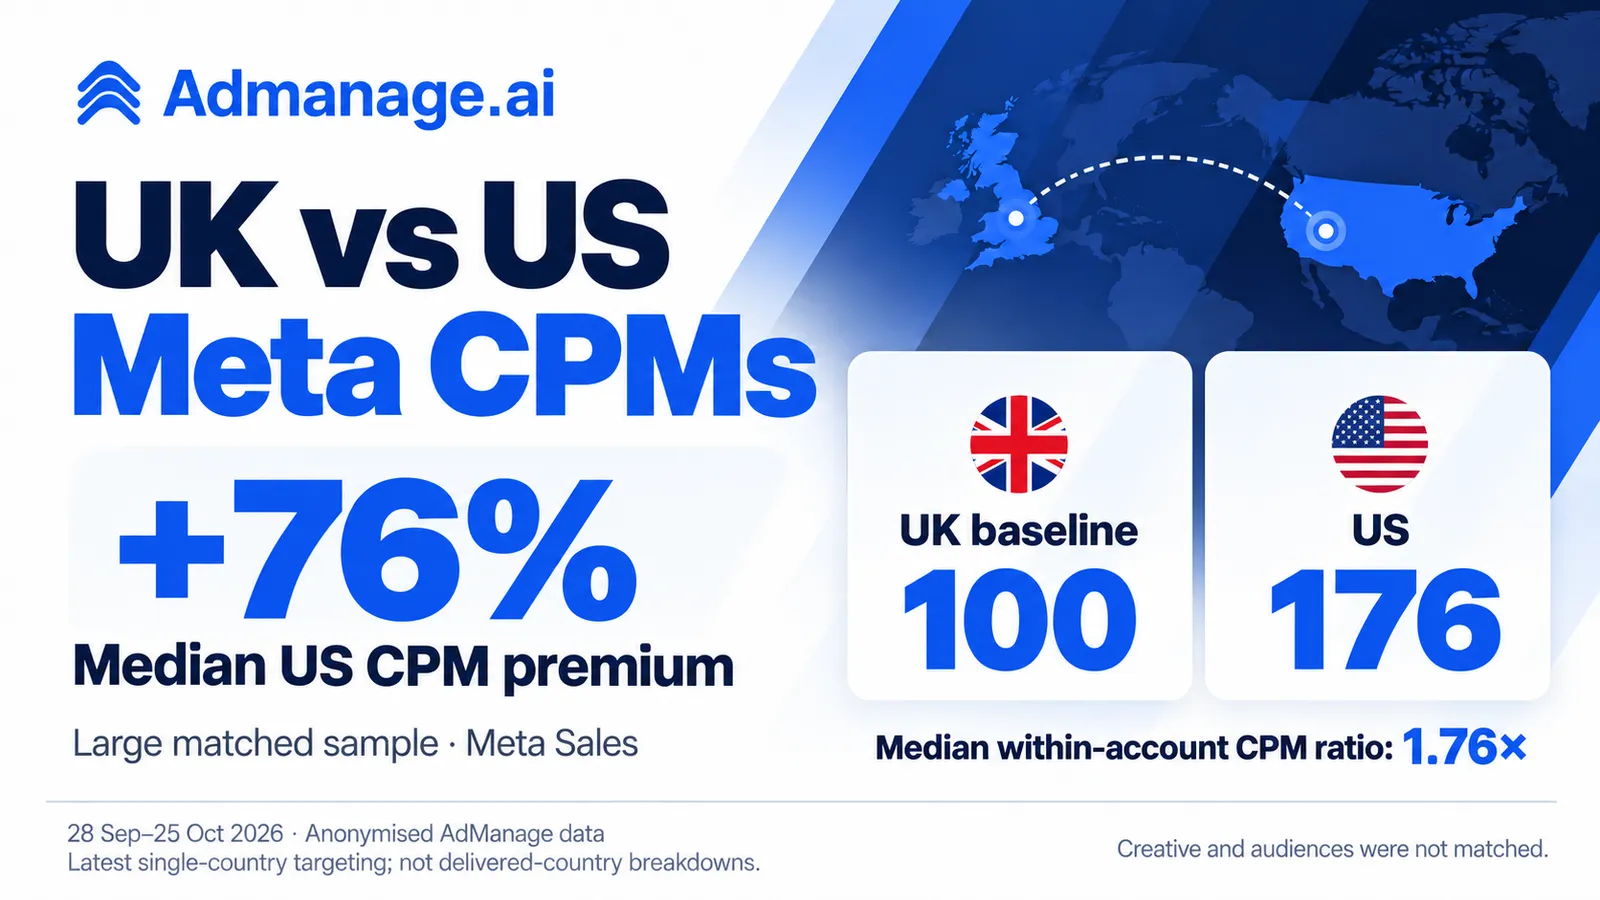
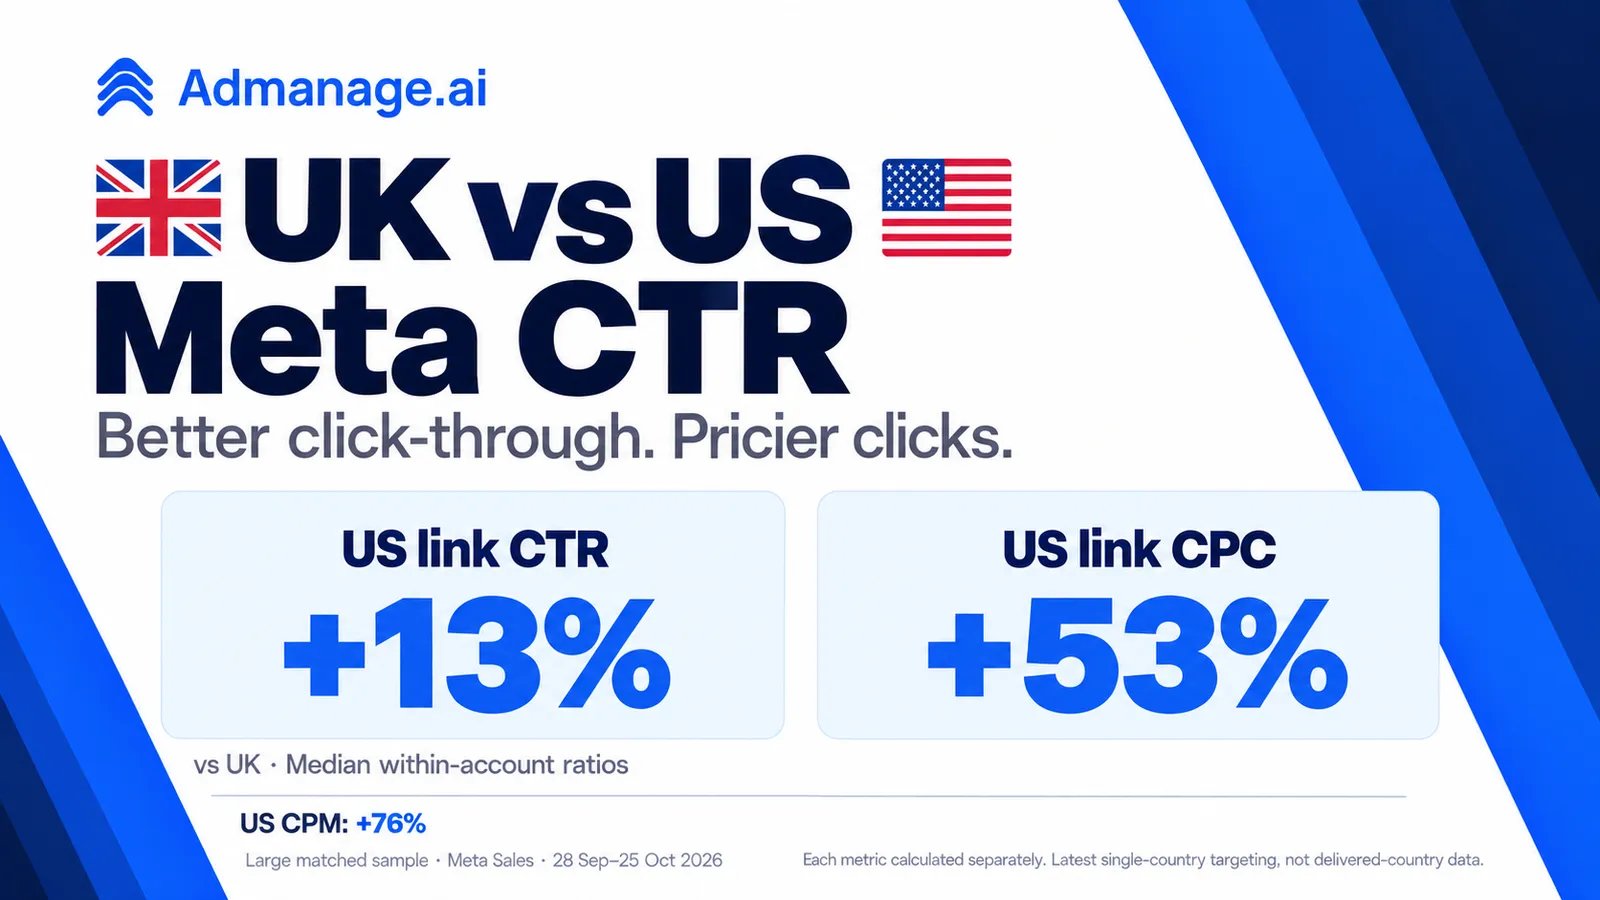
Our UK vs US Meta CTR analysis of anonymised AdManage BigQuery data found a 13% higher median within-account US/UK link CTR ratio across a large matched sample. In that same CTR-eligible sample, the median US CPM premium was approximately 76%, while the median cost-per-link-click premium was approximately 53%. Each metric was calculated separately.
That is the useful distinction for a UK brand testing the US: a higher proportion of impressions turning into link clicks can coexist with more expensive traffic.
This article breaks down the results by industry, explains what we mean by CTR, and works through a fictional £1,000 test. It also shows where a country benchmark helps—and where you need your own conversion and margin data.
Read the country labels carefully. “UK” and “US” refer to the latest strict single-country targeting settings on the ad set. We did not have adequate delivered-country breakdown data for this window. These are observational, targeting-based comparisons; they do not establish national auction prices or prove that changing country causes a particular CTR.
UK vs US Meta CTR: the headline result
For each eligible contributor with qualifying Sales activity targeting both countries, we calculated its total link clicks divided by total impressions in each market over 28 September–25 October 2026. We then calculated its US link CTR divided by its UK link CTR and took the median of those paired ratios.
The median was 1.13×, equivalent to 13% higher link CTR in US-targeted activity. We did not average daily CTR percentages or give larger budgets more votes in the final median.
| Measure | Result |
|---|---|
| Sample | Large matched sample; exact contributor totals kept private |
| Objective | Meta Sales: OUTCOME_SALES |
| Median within-account US / UK link CTR ratio | 1.13× |
| Middle 50% of those link CTR ratios | 0.89×–1.50× |
| Median paired US-minus-UK link CTR difference | +0.19 percentage points |
| Median within-account US / UK CPM ratio | 1.76× |
| Median within-account US / UK cost-per-link-click ratio | 1.53× |
| Observation window | 28 Sep–25 Oct 2026 |
The middle range is useful context. The central half of paired comparisons ran from roughly 11% lower US link CTR to 50% higher US link CTR. The headline describes the middle of this sample; it does not mean every advertiser achieved a US uplift.
The +0.19 percentage-point paired difference is a different summary from the 13% relative uplift. For example, moving from 1.00% CTR to 1.13% is a 13% relative increase but only a 0.13 percentage-point increase. The example explains the units; those rates are not the measured country medians.
Matching contributors reduces differences between entirely unrelated advertiser populations. It does not hold creative, placements, audience composition, product, offer or optimisation settings constant. A stronger US CTR therefore does not prove that a US audience inherently likes an ad more.
Which CTR are we comparing?
Here, link CTR means inline link clicks divided by impressions, multiplied by 100. In BigQuery, we used Meta's inline_link_clicks and impressions fields and recalculated the rate from the totals.
This matters because “CTR” can describe several different Meta metrics. A dashboard showing 3% CTR and another showing 1.5% CTR may be using different numerators.
| Metric | What it divides by impressions | What it can tell you |
|---|---|---|
| CTR (all) | All clicks on the ad | A broader response measure that includes more than link clicks |
| Link CTR | Inline link clicks | How often an impression leads to a click on a destination or experience linked from the ad |
| Outbound CTR | Clicks taking people off Meta technologies | A more specific measure of clicks leaving Meta |
| Landing-page-view rate | Recorded landing-page views | A different measure that also depends on successful page loading and measurement |
Meta describes link clicks as clicks to advertiser-specified destinations on or off Meta technologies, and defines link CTR against impressions. See Meta's official explanation of campaign metrics.
A link click is consequently not necessarily an outbound website visit, a successfully loaded landing page, a unique person or a purchase. Use the same CTR definition across both countries before judging a difference. For a website-sales test, add outbound-click and landing-page-view checks to your own reporting rather than relabelling this link CTR benchmark.
Meta link CTR benchmarks by industry: UK and US
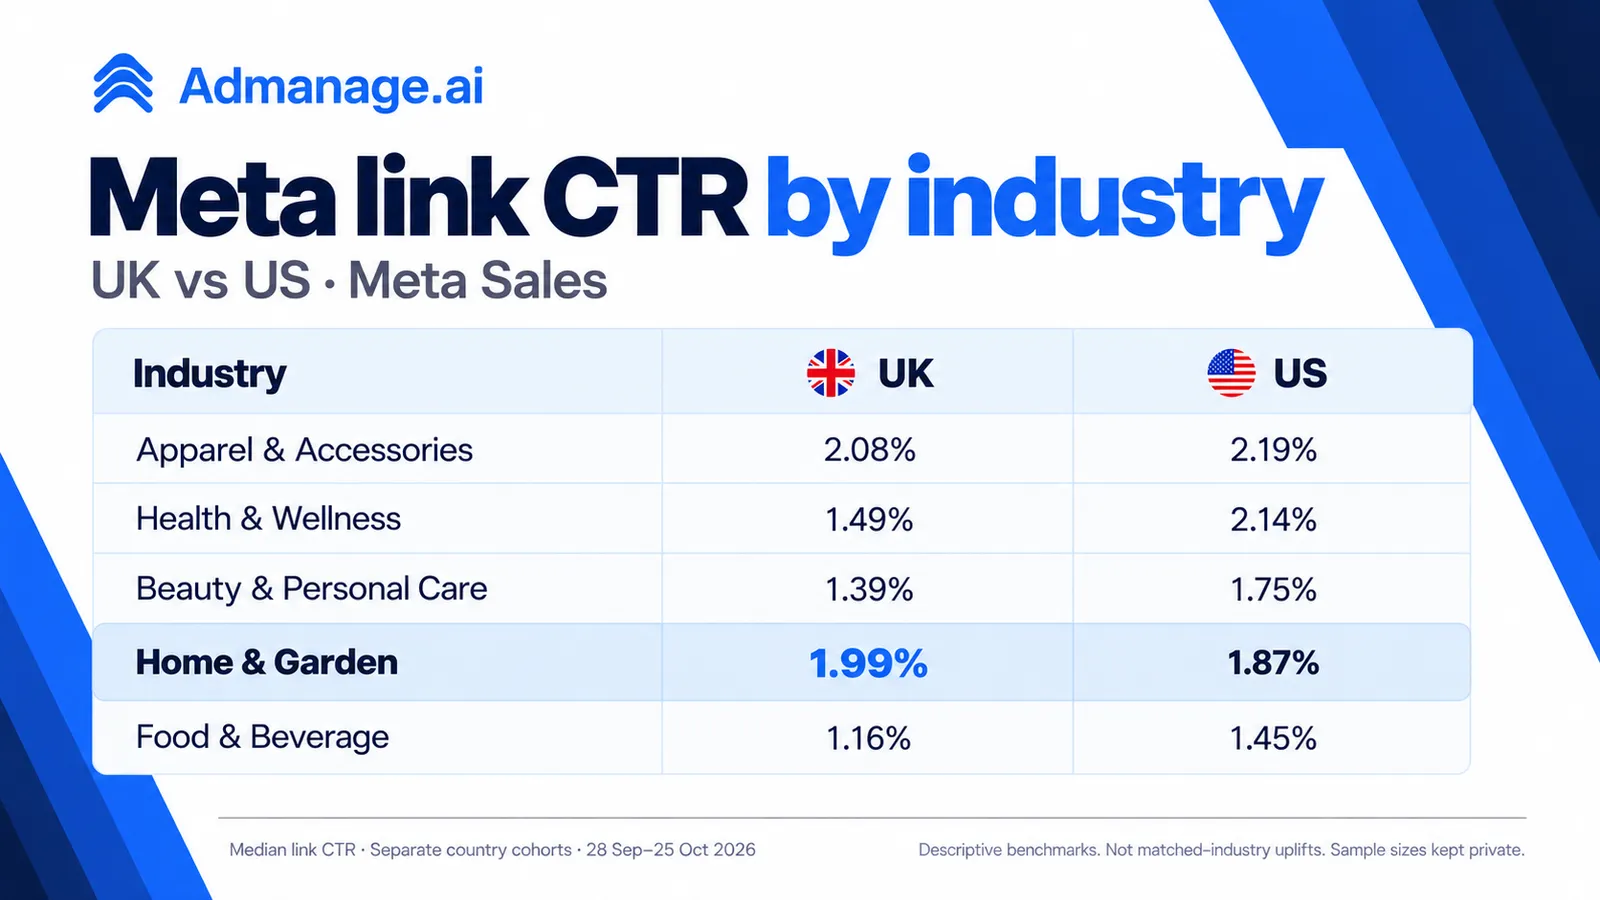
The next table describes five industry cohorts that passed our publication checks independently in both markets. Each percentage is the median of contributor-level link CTRs in that country, rounded to two decimal places.
These are separate country cohorts. They are not matched-industry uplift estimates. Dividing a US median by a UK median is not the same calculation as taking the median within-account US/UK ratio.
| Industry | UK median link CTR | US median link CTR |
|---|---|---|
| Apparel & Accessories | 2.08% | 2.19% |
| Health & Wellness | 1.49% | 2.14% |
| Beauty & Personal Care | 1.39% | 1.75% |
| Home & Garden | 1.99% | 1.87% |
| Food & Beverage | 1.16% | 1.45% |
Apparel & Accessories: similar broad medians, a stronger matched comparison
The broader apparel cohorts recorded median link CTRs of 2.08% in UK-targeted activity and 2.19% in US-targeted activity. Those describe different advertiser populations.
Apparel also passed our checks for a paired industry comparison. Within that matched apparel sample, the median US/UK link CTR ratio was 1.32×, or approximately 32% higher. Its middle 50% was approximately 1.00×–1.66×.
The distinction matters: the apparently small gap between the two broad country medians does not reproduce the paired result. Different contributors enter each broader country cohort, while the paired calculation compares each eligible contributor with itself.
In this CTR-eligible apparel sample, the median CPM ratio was approximately 2.00×, and the median cost-per-link-click ratio was approximately 1.55×. Each was calculated separately. Better click-through still sat alongside considerably more expensive impressions and clicks.
For a UK apparel team, that is a reason to read CTR and CPC together. A US creative test can earn more link clicks per impression without matching the UK cost per click. It still needs to meet the team's own purchase and contribution-margin requirements.
Health & Wellness: a larger descriptive country gap
The Health & Wellness medians were 1.49% UK and 2.14% US. The middle half of contributor-level link CTRs spanned 0.96%–2.53% in the UK cohort and 1.35%–3.92% in the US cohort.
Those wide ranges are a reminder that the industry label is broad. Product category, price, claim, offer, audience and creative can differ substantially inside it.
Use the row to frame a question about your test. Do not interpret it as a forecast that a UK health advertiser will obtain a 2.14% CTR in the US, or as a causal uplift from changing targeting.
Beauty & Personal Care: diagnose the response and the price separately
Beauty's median link CTR was 1.39% in the UK cohort and 1.75% in the US cohort. This descriptive difference can be useful alongside the higher US impression prices in our UK versus US Meta CPM analysis.
For example, if a beauty brand's US link CTR exceeds its UK result but its link CPC rises, the two metrics are not contradicting one another. Check whether the increase in impression cost outweighs the improvement in click-through.
Then check the steps after the click: page loading, conversion rate, purchase value and margin. CTR alone cannot answer whether a new market is commercially attractive.
Home & Garden: the US was not higher in every industry
Home & Garden's separate-country medians went the other way: 1.99% UK versus 1.87% US. Their middle ranges overlapped substantially: 1.29%–2.86% UK and 1.27%–2.82% US.
This is why “US CTR is always better” would be a poor conclusion. Even a positive overall paired result does not establish the same relationship in every category or individual test.
A home retailer should compare its own country results using a consistent click definition and examine differences in shipping, product availability, pricing and creative context before making a country-wide explanation.
Food & Beverage: keep purchase economics in view
Food & Beverage recorded descriptive median link CTRs of 1.16% UK and 1.45% US. The corresponding middle ranges were 0.79%–1.63% UK and 1.06%–2.06% US.
A higher link CTR can be a useful response signal for a food brand testing an offer. It does not resolve the economics of delivery, average basket size, subscription uptake or repeat purchase.
Keep the benchmark in the part of the report it describes: the impression-to-link-click step. Use order and acquisition data for the commercial decision.
The ranges matter as much as the medians
| Industry | UK middle 50% of link CTRs | US middle 50% of link CTRs |
|---|---|---|
| Apparel & Accessories | 1.30%–2.60% | 1.55%–3.22% |
| Health & Wellness | 0.96%–2.53% | 1.35%–3.92% |
| Beauty & Personal Care | 1.04%–1.81% | 1.20%–2.60% |
| Home & Garden | 1.29%–2.86% | 1.27%–2.82% |
| Food & Beverage | 0.79%–1.63% | 1.06%–2.06% |
These intervals describe variation among contributors. They are not confidence intervals, performance targets or a claim that half of your future results will land inside them.
What is a good CTR for Facebook ads?
A useful Facebook ads CTR benchmark matches your click definition, objective, target country and industry. This analysis covers link CTR for Meta Sales activity; it is not a benchmark for Traffic, Leads or Engagement campaigns.
Use the industry ranges as context for your own comparable tests. A rate above the median does not establish good acquisition economics, and a rate below it does not establish an unprofitable campaign. Link CPC, conversion rate and margin determine what the response is worth.
Why higher CTR did not make US clicks cheaper
For a single set of observations using the same spend, impressions and link-click totals, the relationship is exact:
Cost per link click = CPM ÷ (10 × link CTR expressed as a percentage).
For example, a £10 CPM and 1.00% link CTR imply £1.00 per link click: £10 ÷ (10 × 1.00).
That means two forces act together. More expensive impressions raise the cost of traffic. A stronger link CTR offsets some of that cost by earning more link clicks per impression. If CPM rises faster than CTR, cost per link click still increases.
In the matched sample, the median ratios were 1.76× for CPM, 1.13× for link CTR and 1.53× for cost per link click. We calculated each median separately across the paired comparisons.
Do not divide 1.76 by 1.13 and present the answer as our measured median CPC ratio. The ratio of two medians does not generally equal the median of the contributor-level ratios. The hypothetical examples below deliberately apply rounded inputs to one fictional campaign instead.
A worked £1,000 UK-to-US test
Assume a fictional UK campaign has a £10 CPM and 1.00% link CTR. For the US version, assume a 76% higher CPM and 13% higher link CTR: £17.60 CPM and 1.13% link CTR.
These are planning assumptions for arithmetic, not measured country prices or a forecast.
| Hypothetical measure | UK example | US example |
|---|---|---|
| Budget | £1,000 | £1,000 |
| CPM | £10.00 | £17.60 |
| Link CTR | 1.00% | 1.13% |
| Impressions | 100,000 | About 56,818 |
| Link clicks | 1,000 | About 642 |
| Cost per link click | £1.00 | About £1.56 |
The US example earns 13% more link clicks per impression, yet the same budget buys approximately 36% fewer link clicks because impressions cost substantially more.
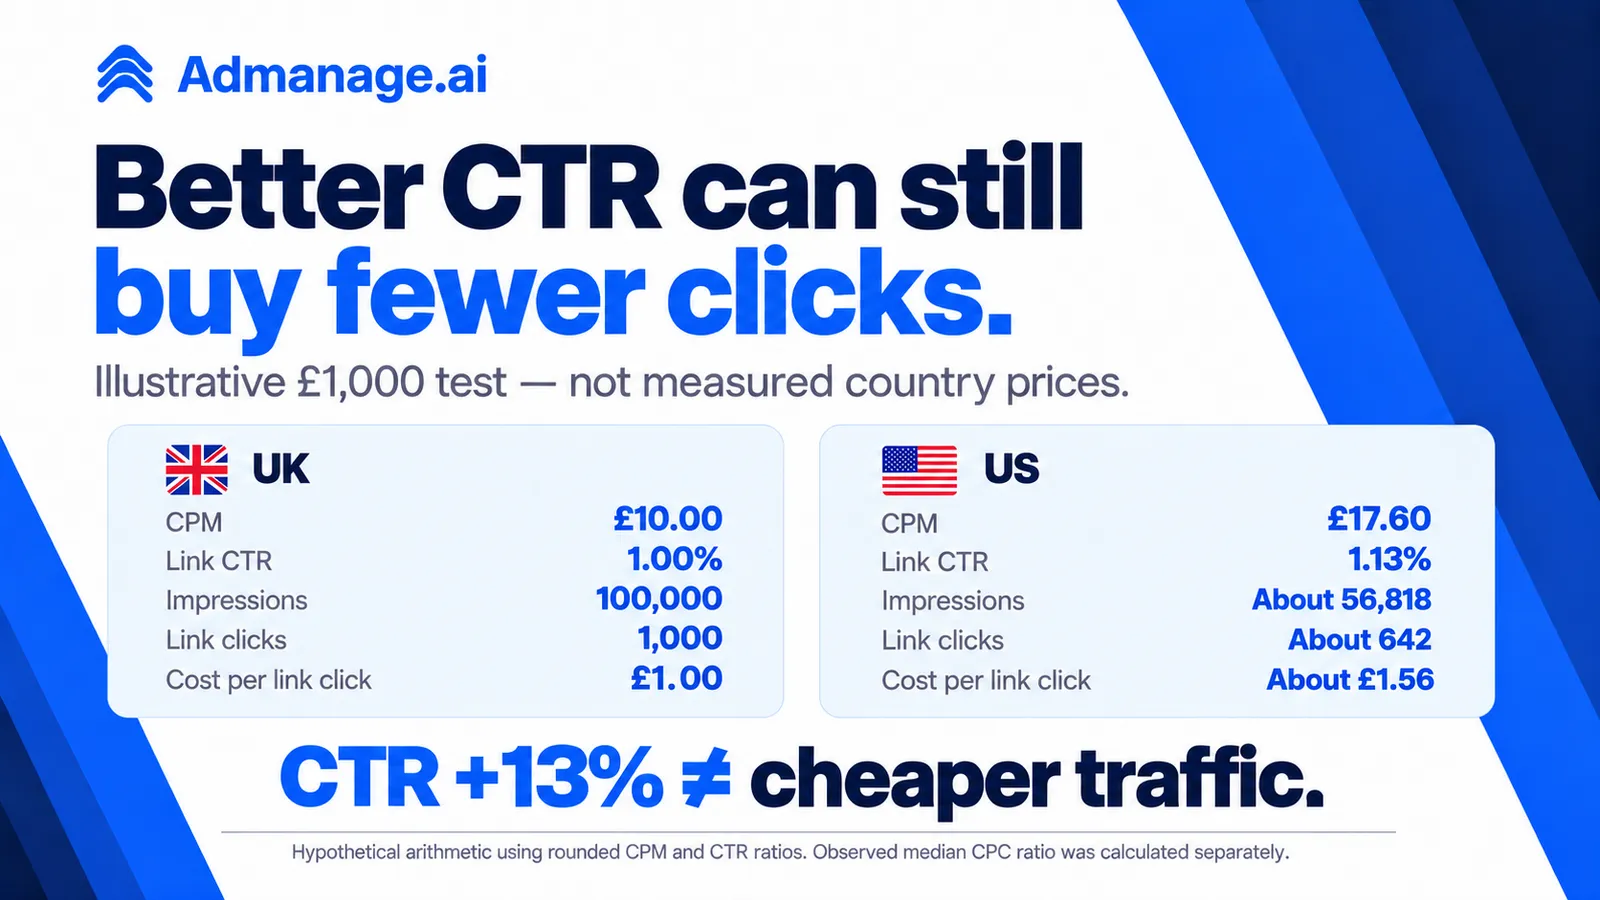
In this fictional calculation, cost per link click rises by approximately 56%. That is the arithmetic result of the assumed CPM and CTR. The 53% observed median CPC premium above is a separate empirical calculation and should not be substituted into this example.
What CTR would offset a 76% CPM increase?
Holding cost per link click constant requires the same proportional increase in link CTR as in CPM.
At £17.60 CPM, the fictional US campaign would need 1.76% link CTR to maintain the UK example's £1.00 cost per link click. Moving from 1.00% to 1.76% is a 76% relative CTR increase, not a 76 percentage-point increase.
This is a useful planning calculation, not a reason to force a creative test toward a click target at any cost. A click-focused hook can attract people who do not buy. The purchase and margin checks still decide whether the traffic works.
Does higher CTR mean lower CPA?
Not necessarily. Click-through describes one step of the journey. Purchase CPA also depends on what happens after the click and how purchases are attributed.
For a simplified click-only funnel, purchase CPA equals cost per link click divided by the click-to-purchase conversion rate. If CPC rises, conversion rate must improve enough to offset it to keep that simplified CPA unchanged.
For example, using the fictional CPCs above and assuming a 2% click-to-purchase conversion rate in both countries produces about £50 UK CPA versus £77.88 US CPA. If the fictional US click-to-purchase rate were 3%, its calculated CPA would fall to about £51.92.
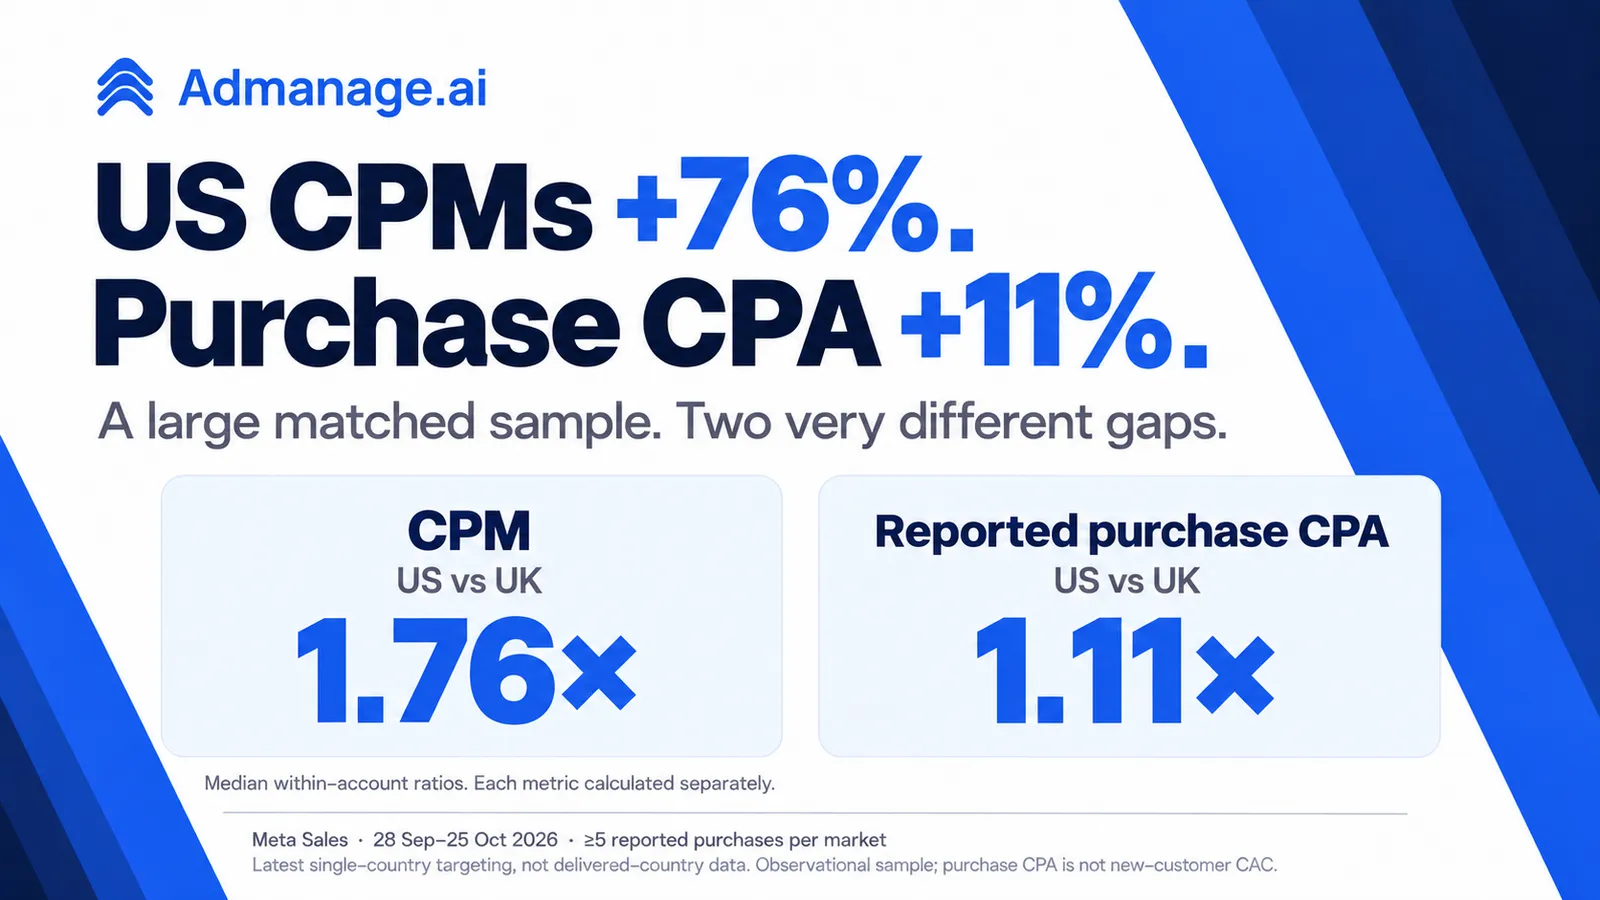
These conversion rates are invented inputs, not results from the CTR analysis. Meta-reported purchase CPA can include view-through attribution and repeat customers, so it should not be mechanically reconstructed from this simplified funnel. Our UK versus US Meta purchase CPA study examines reported purchase costs separately.
For your expansion decision, put CTR next to link CPC, landing-page views, reported purchases, new-customer acquisition cost and contribution margin. A better rate at the top of the funnel is useful only in the context of the traffic's eventual value.
How stable was the CTR finding?
We reran the paired comparison under several alternative eligibility rules. Each row below is its own eligible sample, rather than a decomposition of the main result.
| Check | Median US / UK link CTR ratio |
|---|---|
| Main comparison | 1.13× |
| Higher activity: at least $1,000 estimated spend and 5,000 impressions in each country | 1.13× |
| At least seven active reporting dates in each country | 1.13× |
| First half: 28 Sep–11 Oct, using half-window eligibility thresholds | 1.16× |
| Second half: 12–25 Oct, using half-window eligibility thresholds | 1.15× |
| Activity from ad sets last updated before the observation window | 1.13× |
The direction remained positive in these checks. The half-window results do not average back to the overall ratio because contributor eligibility, activity mix and the median calculation differ.
The last check reduces one concern about applying current targeting settings to older activity. It cannot prove that historical country delivery, audience composition or every setting remained unchanged.
A reproducible bootstrap of the matched contributors gave a 95% interval of approximately 1.05×–1.21× for the main median ratio. This estimates sampling variation conditional on the observed sample. It does not correct selection bias, missing country delivery information, repeated measurement across related businesses or differences in creative and campaign settings.
A practical CTR scorecard for UK brands testing the US
- Match the metric. Put link CTR next to link CTR. If you use outbound CTR for your own website reporting, keep that definition consistent too.
- Match the comparison. Align dates, objective, offer and intended audience where possible. Treat industry medians as context, not a substitute for your own paired test.
- Read CPM and CPC beside CTR. Better click-through can coexist with more expensive traffic. Calculate what would be required to maintain your own cost per click.
- Check that the click became a usable visit. Compare outbound clicks and landing-page views, then investigate page speed, tracking and the landing experience if they diverge.
- Judge the acquisition. Use purchases, new-customer economics and contribution margin before scaling a country solely because CTR looks strong.
When comparing creative, retain enough consistency that the result is interpretable. If the country, offer, format, price and landing page all change at once, a CTR difference has several possible explanations.
Methodology and limitations
Source, window and eligibility
We made a fresh, read-only query of anonymised AdManage BigQuery Meta data on 28 October 2026, covering 28 September–25 October 2026. This is a large matched sample of eligible activity, not a random sample of all Meta advertisers. Exact contributor totals and account identifiers remain private throughout the article and images.
We restricted the analysis to the reported Sales objective, OUTCOME_SALES, excluded known internal/test contributors, and required at least $500 estimated USD spend and 1,000 impressions per contributor-country cohort for the main comparison. A UK link CTR above zero was required for the paired ratio to be defined. Internally inconsistent cohorts with fewer reported all-clicks than link-clicks were excluded.
Spend eligibility used the app's fixed currency-conversion estimates. These are screening estimates, not a historical foreign-exchange reconstruction. CTR itself has no currency, and currency conversion cancels in a within-account US/UK cost ratio when the same account currency applies in both countries.
Geography and aggregation
We joined insight rows to the latest ad-set record and accepted a single explicit country, GB or US, without additional region, city, postcode, custom-location, market or country-group targeting. Because the latest targeting record can differ from historical settings, geography is a material limitation.
We summed clicks and impressions before calculating each contributor-country rate. Missing inline-link-click values were treated as zero. We then took unweighted medians across eligible contributors. The results are neither spend-weighted nor impression-weighted market averages.
Broader country and industry medians use separate country cohorts. Matched ratios use only qualifying contributors represented in both markets. Industry labels come from AdManage's existing classification and can cover diverse products and business models.
Publication checks and sensitivities
We published only cohorts meeting our contributor-coverage and spend-concentration rules in both markets. We withhold paired industry estimates that fail those checks, even where both broader country cohorts are publishable. The apparel paired comparison passed independently; other paired industry estimates are not published here.
For the half-window checks, eligibility was at least $250 estimated spend and 500 impressions per country in that half. The settings sensitivity used qualifying activity from ad sets whose latest update timestamp preceded the window. The bootstrap used 1,000 resamples with replacement at the matched-contributor level and a fixed seed.
What this analysis cannot establish
It cannot establish a universal “good CTR,” a causal benefit from entering the US, identical creative or audience conditions, delivered-country auction prices, unique website visitors, incrementality, profitability or new-customer CAC. The window is one period, and the advertiser mix may differ from yours. The industry ranges are descriptive; the paired-ratio bootstrap interval answers a different question.
What should you do with the result?
Use a consistent link CTR definition, compare the relevant country and industry, and read the result beside the price of impressions and clicks. A stronger US CTR can be a positive creative response signal while traffic remains more expensive.
For a UK brand planning US tests, build a view that connects those response metrics to acquisition outcomes. Explore AdManage's creative reporting to review the ads behind your results, and use the linked CPM and CPA studies for the surrounding cost context.