
Planning to take a UK brand into the US? Our latest comparison of UK vs US Meta CPMs found a substantial difference in the cost of buying impressions: the median US CPM was 76% higher within the same ad accounts.
We queried anonymised AdManage BigQuery data for 28 September–25 October 2026, restricted the comparison to Meta's Sales objective, and identified a large matched sample with enough eligible activity targeting each country separately.
The practical question is what that difference means for your next expansion test. Below, we break down the result by industry, show what happens to a hypothetical £1,000 budget, and explain why a higher CPM does not automatically establish a higher purchase CPA.
Read the country labels carefully. Country in this analysis means the latest single-country targeting settings on an ad set. We did not have adequate delivered-country breakdown data for this window. These are targeting-based comparisons, not measured national auction prices.
UK vs US Meta CPMs: the headline comparison
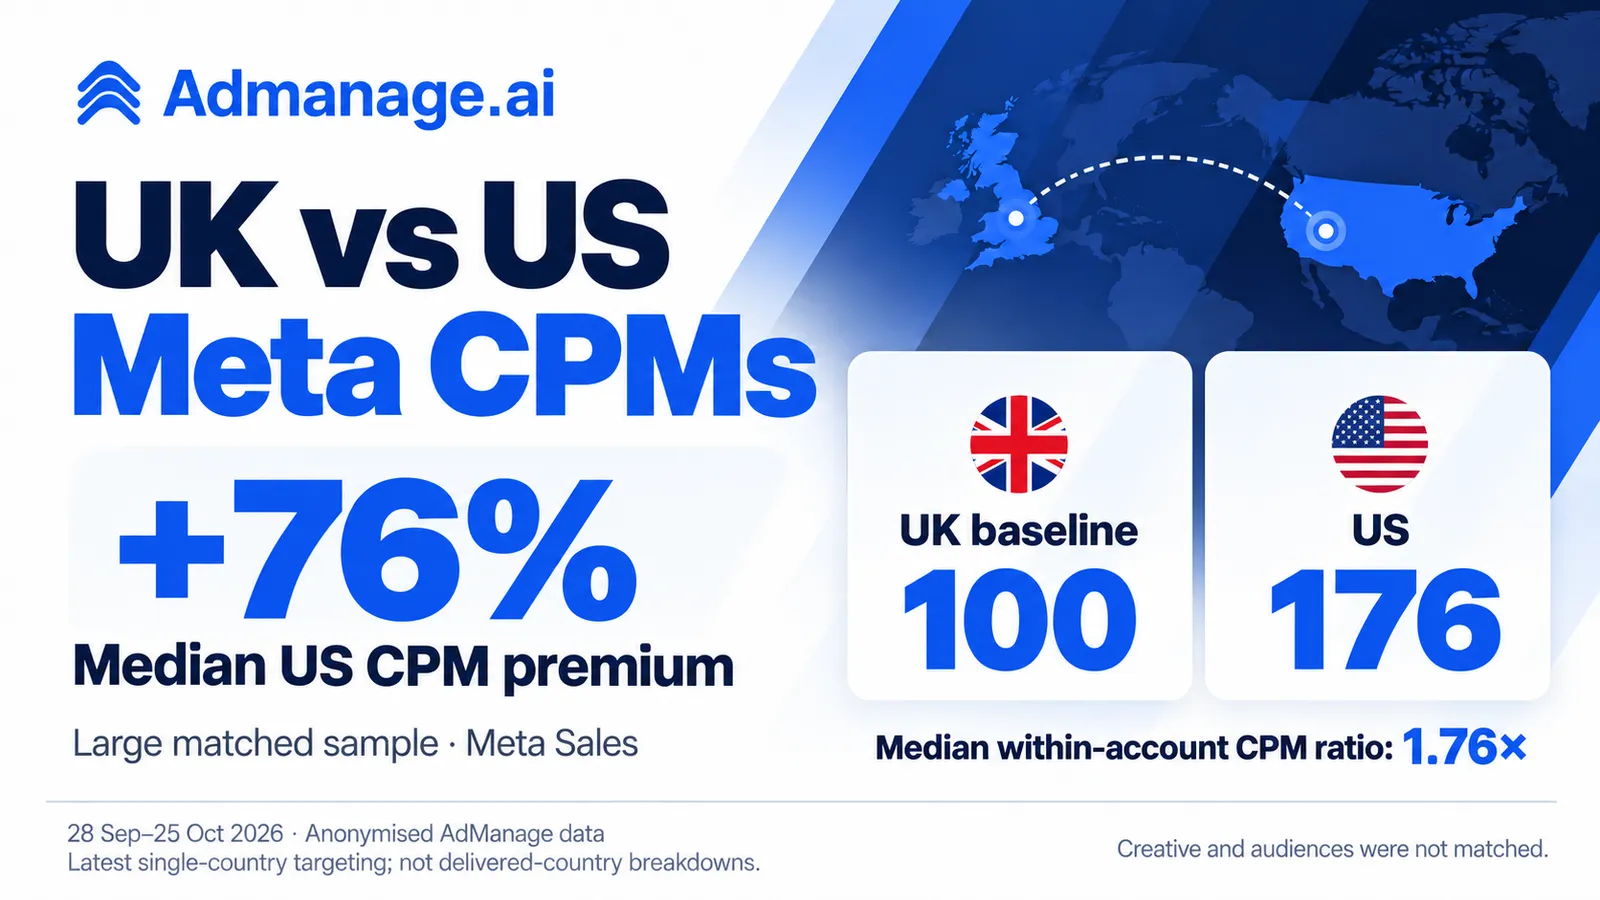
For each eligible account, we calculated its US-targeted CPM and UK-targeted CPM over the full 28-day window. We then divided that account's US CPM by its UK CPM and took the median across accounts.
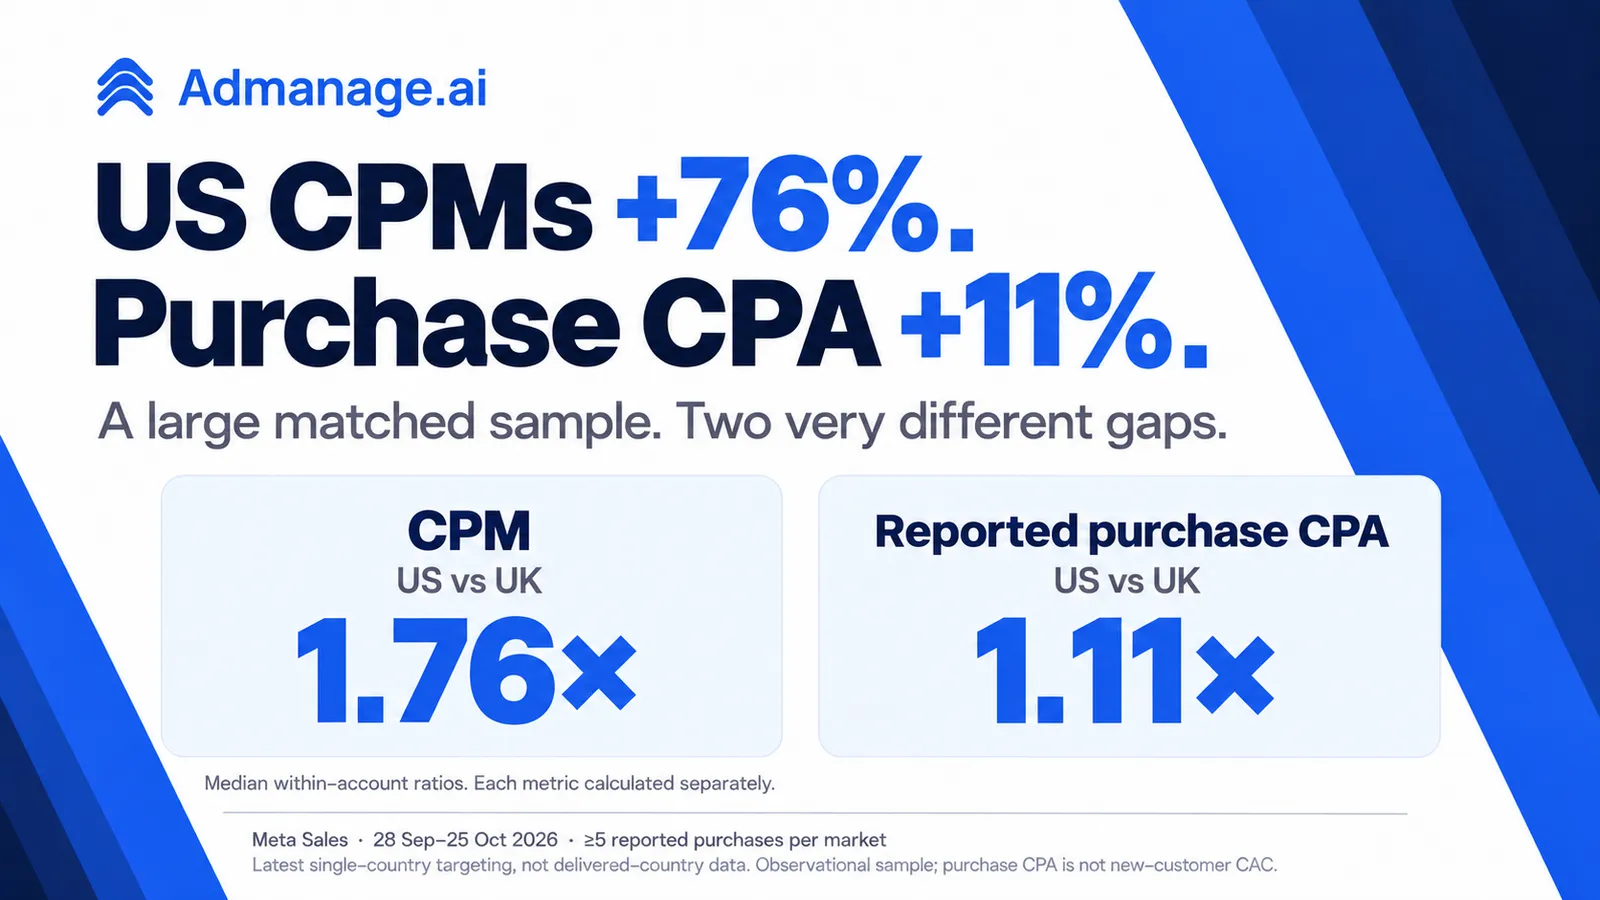
The result was 1.76×: a median US CPM premium of 76%.
| Measure | Result |
|---|---|
| Sample | Large matched sample |
| Reported objective | Sales: OUTCOME_SALES |
| Median within-account US / UK CPM ratio | 1.76× |
| Middle 50% of account-level ratios | 1.44×–2.25× |
| Eligible spend per account-country cohort | At least $500 estimated USD |
| Eligible impressions per account-country cohort | At least 1,000 |
| Observation window | 28 Sep–25 Oct 2026 |
That middle range matters. The central half of account comparisons showed US CPMs approximately 44% to 125% higher. The 76% headline is the middle of this sample, not a surcharge that applies to every advertiser.
Matching accounts helps reduce differences between completely unrelated advertiser populations. It does not match the creative, placements, audiences, products, optimisation goals or campaign settings used in the two markets.
Why not just compare two country averages?
Our broader eligible Sales sample covered US-targeted and UK-targeted activity. The separate-country median CPMs were approximately $31 and $14, respectively, using fixed USD conversion estimates.
Those are useful descriptive benchmarks, but they describe different account populations. Dividing those two medians is not the same calculation as comparing each account with itself.
The 76% finding comes from the large matched comparison. It is neither a spend-weighted market average nor the ratio of two separately calculated country medians. For broader context on metric definitions and different comparison groups, see our Facebook CPM benchmarks by industry.
Meta CPM benchmarks by industry: UK and US
Country is only one part of a useful benchmark. A UK apparel brand and a US health brand are different comparison groups even when both are running Sales campaigns.
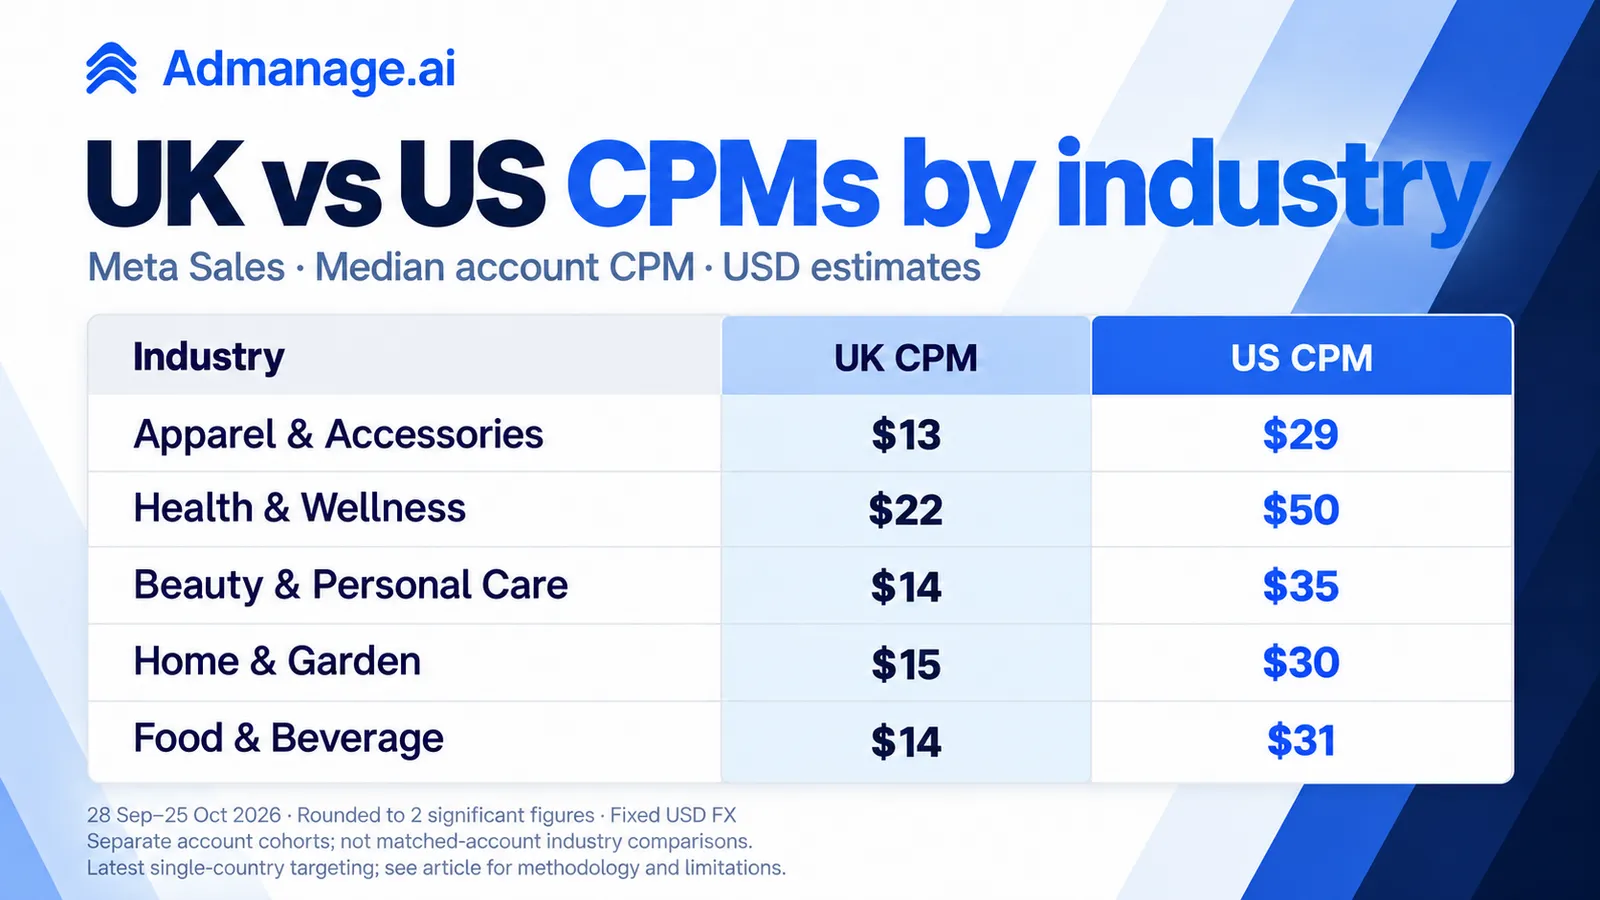
The following table narrows the data to five industry labels with enough contributors in both countries. Values are medians across accounts, rounded to two significant figures and shown in estimated USD.
These industry rows compare separate country cohorts. They are not matched-account industry premiums. Each row must pass our minimum sample-size and spend-concentration checks independently in both markets.
| Industry | UK median CPM | US median CPM |
|---|---|---|
| Apparel & Accessories | $13 | $29 |
| Health & Wellness | $22 | $50 |
| Beauty & Personal Care | $14 | $35 |
| Home & Garden | $15 | $30 |
| Food & Beverage | $14 | $31 |
Apparel & Accessories: a matched-account result of about 2×
Apparel gives us a more specific expansion example because its matched sample also passes our publication checks.
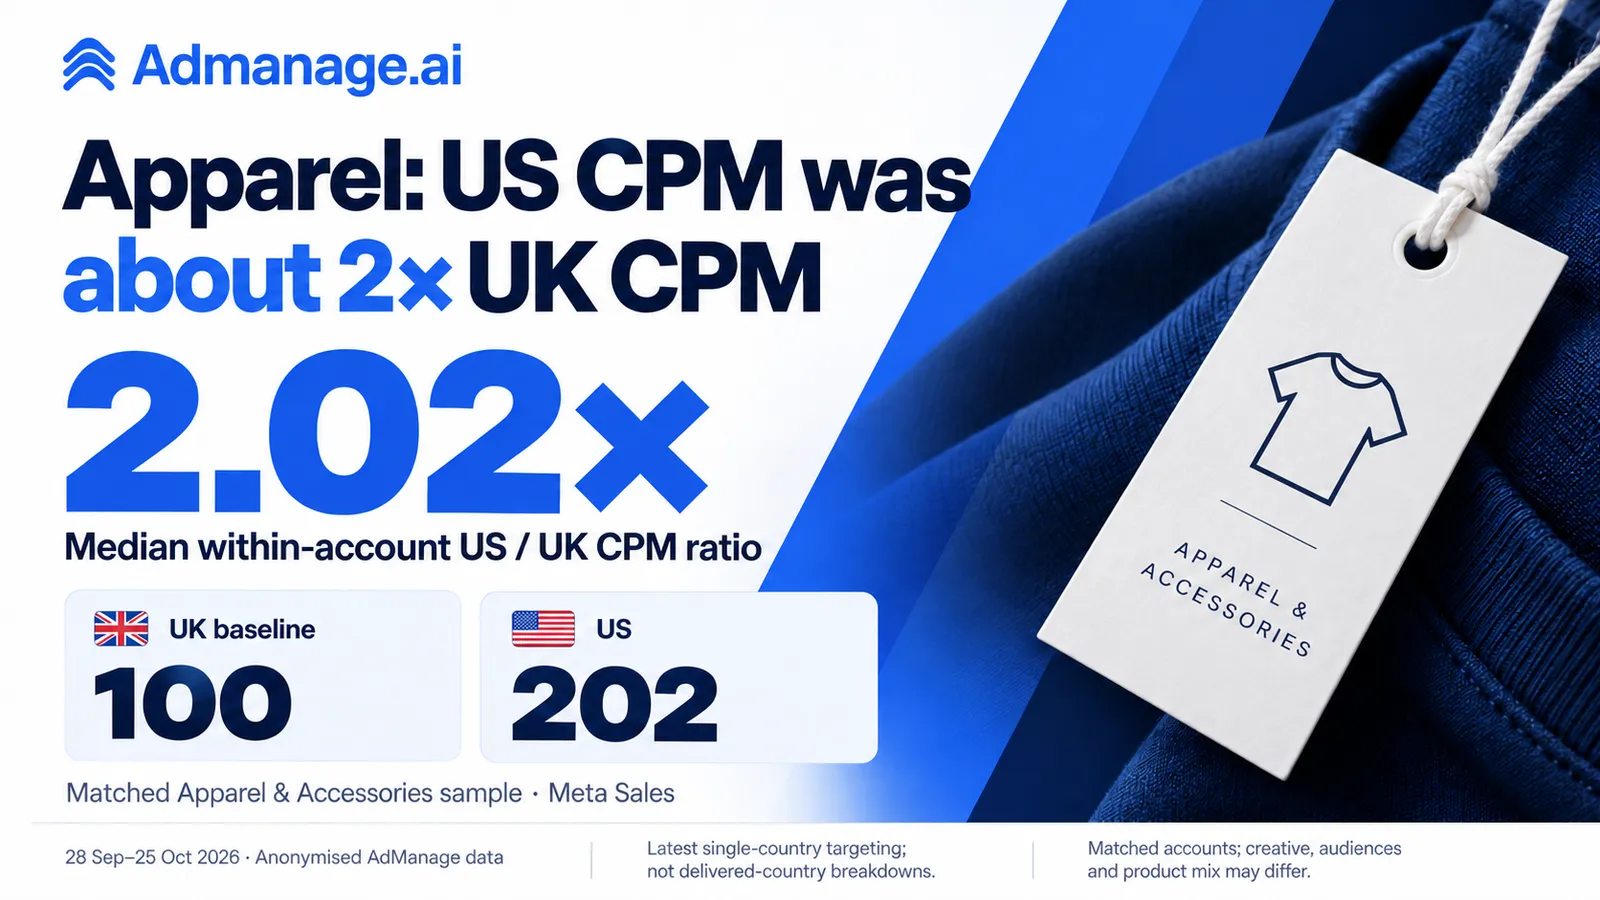
Across the matched Apparel & Accessories sample with eligible US-targeted and UK-targeted Sales activity, the median within-account US / UK CPM ratio was 2.02×. That is approximately 102% higher in the US-targeted activity.
The middle half of these account-level ratios ran from approximately 1.70× to 2.57×. Even inside one industry, the typical comparison covered a meaningful range.
A UK apparel team can use that as context when its US test buys fewer impressions for the same budget. It still needs to check whether the US creative, audience, offer and conversion results justify the cost.
The broader apparel row above—$13 UK versus $29 US—uses different country cohorts. It should not be substituted for the paired calculation.
Health & Wellness: a higher-cost category in both samples
The separate Health & Wellness cohorts had median CPMs of approximately $22 in UK-targeted activity and $50 in US-targeted activity.
The middle 50% of account CPMs also varied widely: approximately $14–$35 in the UK sample and $30–$79 in the US sample.
For a health brand expanding internationally, this suggests that a single global CPM target provides limited context. Start with the target country and objective, then compare the relevant category.
It does not establish that an individual UK health advertiser should expect a $50 CPM in the US. Account sizes, product categories, targeting and creative mixes differ.
Beauty & Personal Care: separate the category benchmark from your own test
Beauty's descriptive median was approximately $14 in the UK sample and $35 in the US sample.
That is a useful discussion starter for a beauty team reviewing an expansion plan. It is not evidence that copying its UK campaign into the US will produce that exact relationship.
We withhold matched industry ratios when the paired sample is too small or too concentrated in one account's spend. That rule applies even when a broader industry table has enough accounts.
Home & Garden and Food & Beverage: account for the offer after the impression
Home & Garden recorded median CPMs of approximately $15 UK / $30 US. Food & Beverage recorded approximately $14 UK / $31 US, again in separate country cohorts.
The media benchmark is only part of the expansion decision. A home retailer's shipping cost, a food brand's delivery promise, and the purchase value of the offer can change what an affordable acquisition looks like.
Use the CPM table to frame the cost of exposure. Use your own conversion data and contribution margin to judge whether that exposure is commercially worthwhile.
What a 76% CPM premium means for a UK-to-US budget
The simplest way to translate the headline into planning is to hold either impressions or budget constant.
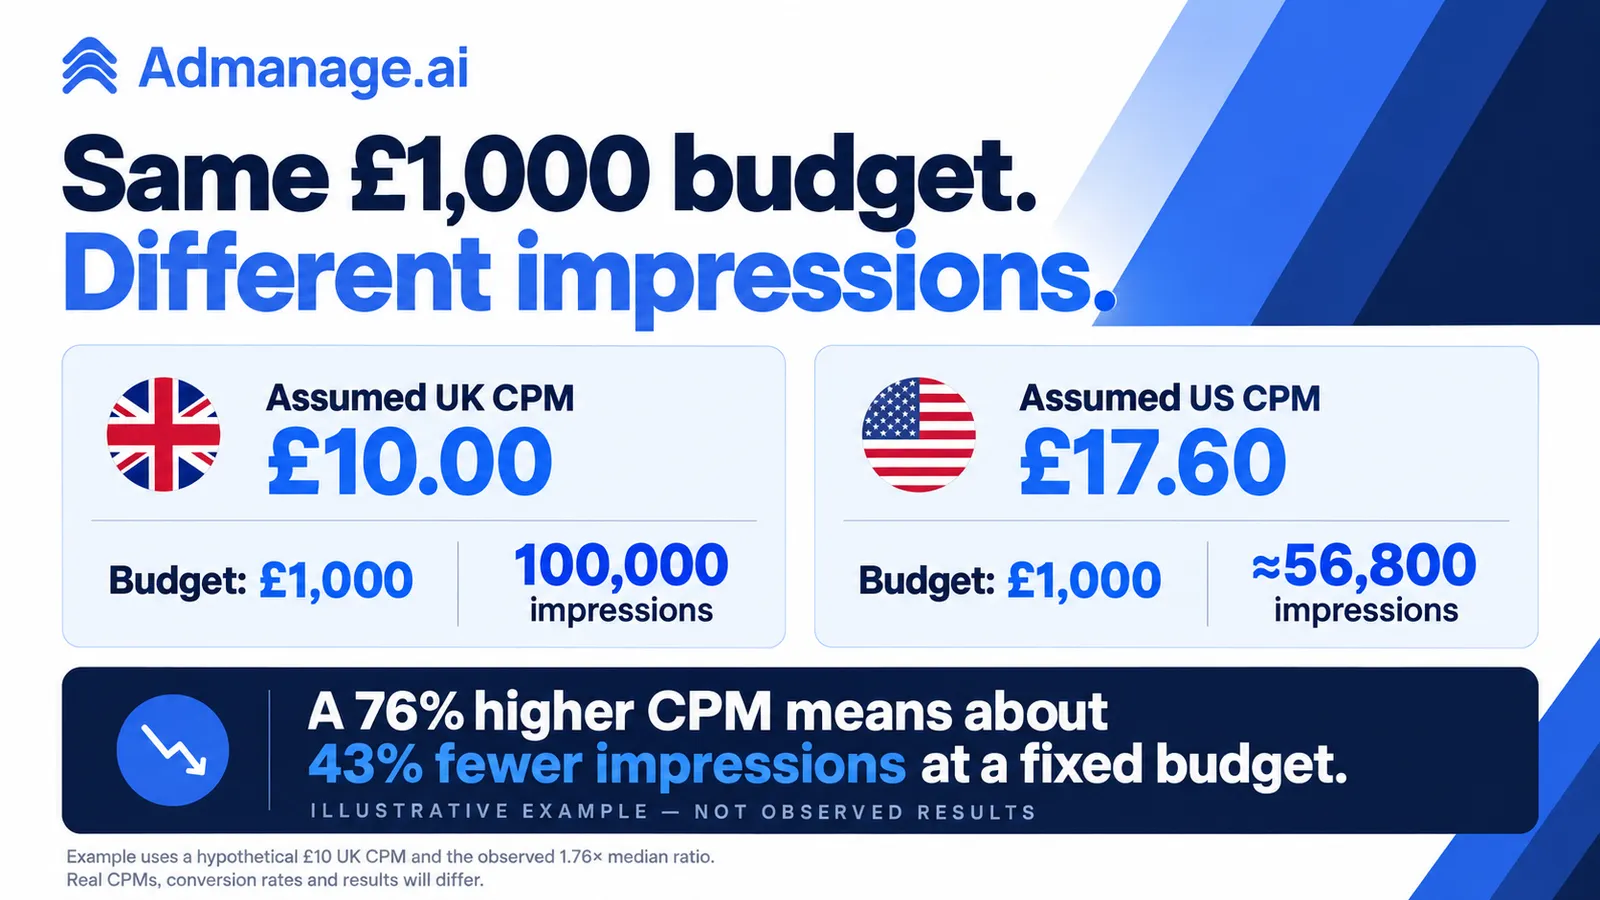
The next examples are hypothetical arithmetic. We assume a UK CPM of £10 and apply the observed 1.76× ratio to produce an assumed US CPM of £17.60. Neither price is a measured country median from our data.
Example 1: buying the same number of impressions
To buy 100,000 impressions:
| Hypothetical case | Assumed CPM | Impressions | Modelled spend |
|---|---|---|---|
| UK baseline | £10.00 | 100,000 | £1,000 |
| US with a 1.76× CPM | £17.60 | 100,000 | £1,760 |
At those assumed CPMs, matching the impression volume would require £760 more spend.
This can help a team separate a distribution-cost assumption from its performance target. It is not a recommendation to increase a budget by 76% or a forecast of the CPM its own account will achieve.
Example 2: keeping the budget at £1,000
If the budget stays fixed instead:
| Hypothetical case | Budget | Assumed CPM | Modelled impressions |
|---|---|---|---|
| UK baseline | £1,000 | £10.00 | 100,000 |
| US with a 1.76× CPM | £1,000 | £17.60 | About 56,800 |
A 76% higher CPM means about 43% fewer impressions at the same budget. The percentages differ because impressions change with the inverse of CPM.
These are impressions, not unique people reached. Repeated exposures and reach cannot be inferred from this calculation.
When setting the test, decide what evidence the budget needs to generate: exposure for a creative diagnosis, enough clicks to inspect a landing page, or purchases to evaluate acquisition economics. Our creative testing budget guide covers the broader budgeting framework.
Higher CPM does not automatically mean higher purchase CPA
The impression-cost premium did not translate one-for-one into the click-cost premium in our matched sample.
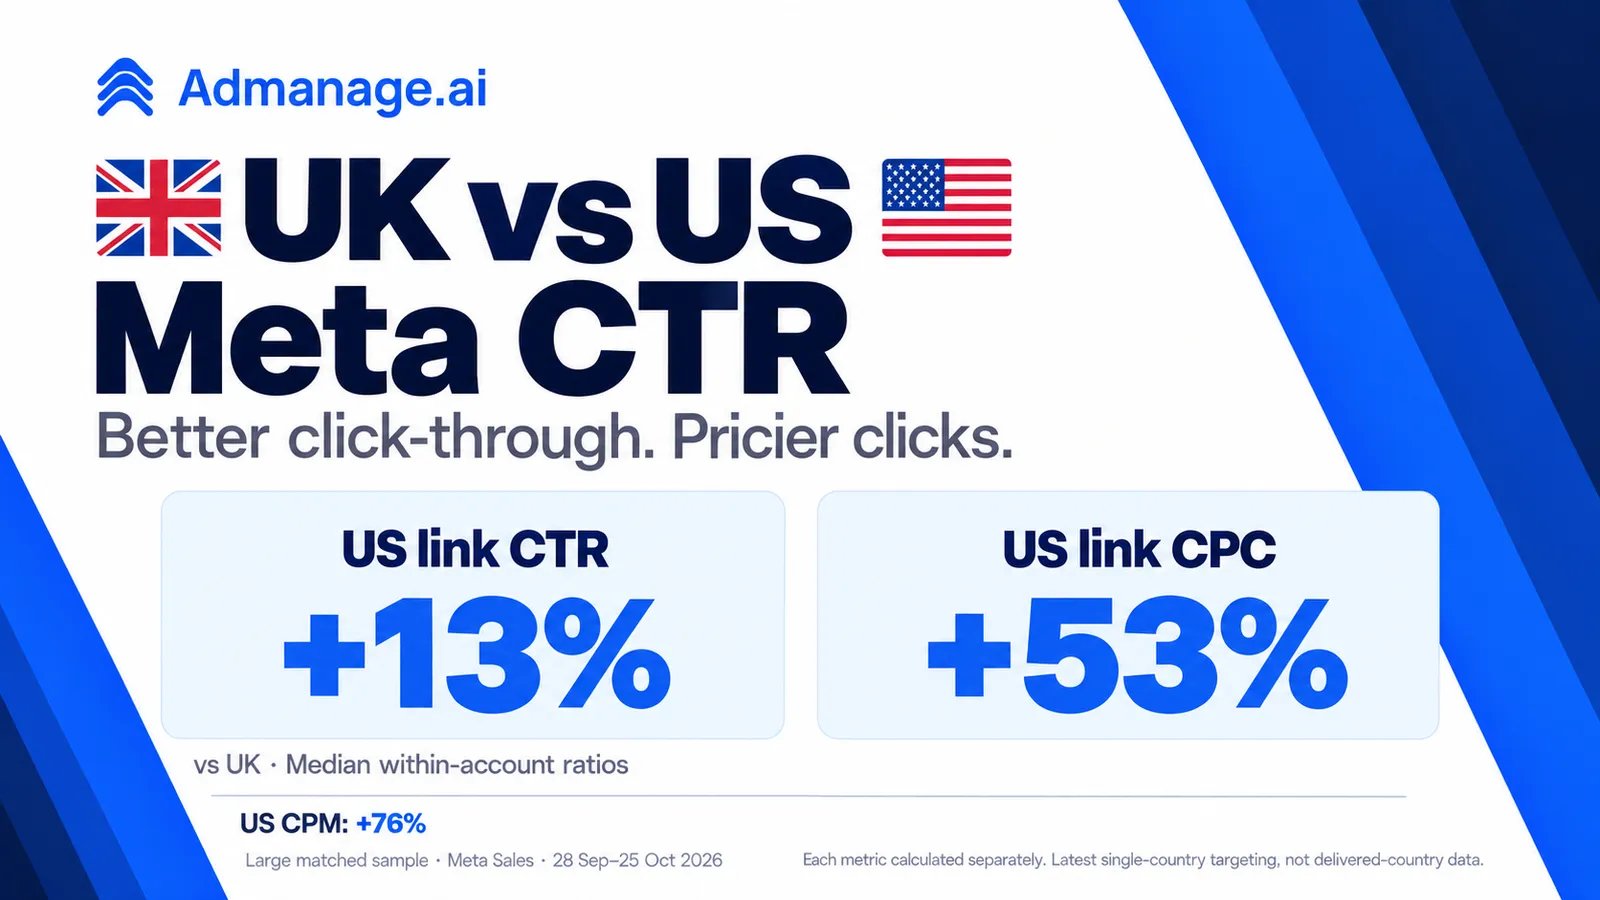
Across the same large matched sample, the median within-account US / UK link CPC ratio was approximately 1.53×, compared with 1.76× for CPM.
That is about 53% higher link CPC, versus 76% higher CPM. These are separately calculated medians of account-level ratios. They should not be divided to reconstruct a median CTR change.
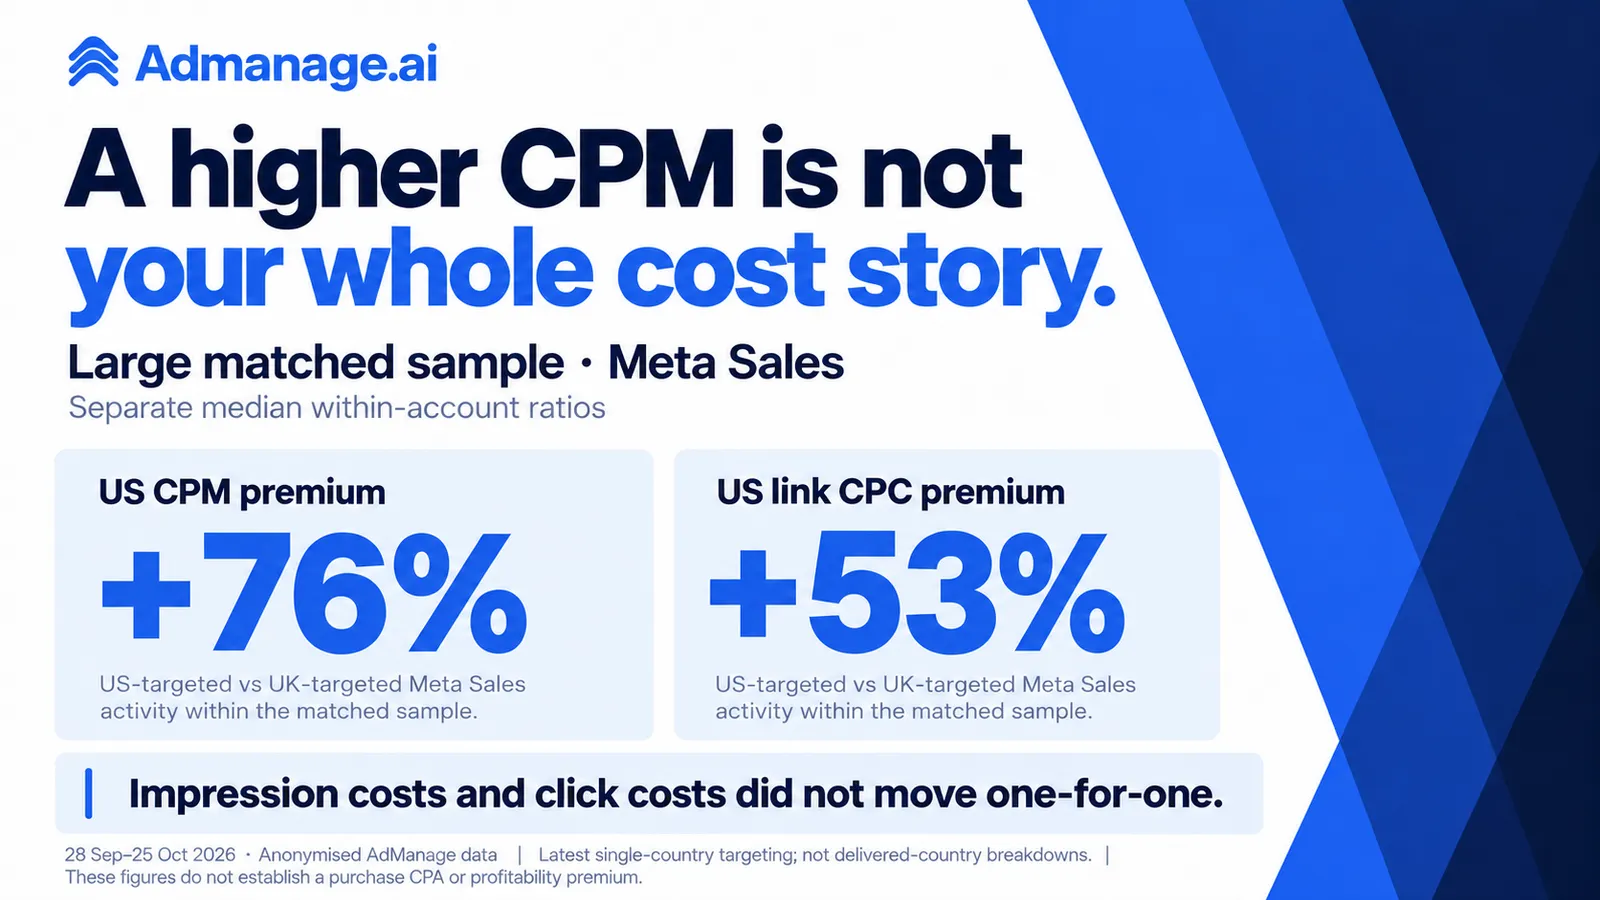
Neither result establishes a purchase CPA premium. A purchase outcome also depends on what happens after the click, and reported Meta purchases may use different attribution settings.
Example 3: a more expensive impression can still produce a similar CPA
Here is a deliberately simplified, click-only hypothetical model. It excludes view-through attribution, repeat purchases and other real-world complications.
| Hypothetical case | CPM | Link CTR | Purchase rate per link click | Modelled purchase CPA |
|---|---|---|---|---|
| UK baseline | £10.00 | 1.5% | 3% | £22.22 |
| US, same click and purchase rates | £17.60 | 1.5% | 3% | £39.11 |
| US, stronger click and purchase rates | £17.60 | 2.0% | 4% | £22.00 |
In the first US scenario, the more expensive impressions raise the modelled CPA because the other rates stay unchanged. In the second, stronger downstream performance offsets the impression-cost increase.
This does not show that a real advertiser can obtain those rates. It shows why CPM alone cannot answer whether an expansion test is profitable.
If your US CPA is high, diagnose the impression cost, click-through and purchase conversion steps separately. See our guide to reducing Facebook Ads CPA.
A practical scorecard for testing a UK brand in the US
1. Write down the UK baseline before launching
Record the time window, objective, optimisation goal, currency, placements, attribution settings and audience type alongside CPM, link CTR, link CPC and purchase CPA.
Distinguish prospecting from existing-customer activity. A blended account result can hide a different customer mix, even before geography changes.
2. Make the US test easier to interpret
Use a clear country-specific structure and consistent naming. Record which elements you intended to hold similar and which you deliberately localised.
A US-facing landing page, delivery promise, pricing presentation and offer should be reviewed before treating a conversion-rate difference as a media-buying problem. Matching an ad account does not make its two markets identical.
3. Judge the acquisition outcome alongside the media cost
Track whether the test produces commercially useful purchases, then assess the result against contribution margin, fulfilment costs, returns and the customer value assumptions your business actually uses.
A rising CPM can coexist with an acceptable CPA. A low CPM can coexist with poor purchase economics. The benchmark provides context for the former; it does not validate either business outcome.
For the operational side of expanding a test, see our Facebook Ads scaling guide.
Methodology and limitations
We re-queried the AdManage BigQuery warehouse on 28 October 2026 for the inclusive window 28 September–25 October 2026. The candidate pool was a large sample previously identified with eligible US- or UK-targeted Sales activity, rather than a random sample of all Meta advertisers.
We summed spend, impressions and inline link clicks from daily ad insights. We calculated CPM as spend divided by impressions, multiplied by 1,000; link CPC uses spend divided by inline link clicks. We did not average daily CPM or CPC fields.
Country, objective and eligibility
The analysis joins insights to the latest ad-set configuration. It includes an ad set only when its country array names exactly one country and there are no additional region, city, ZIP, custom-location, geo-market or country-group targeting arrays.
Only OUTCOME_SALES activity contributes. Each account-country cohort needs at least $500 estimated USD spend and 1,000 impressions. Internal AdManage accounts and unsupported account currencies are excluded.
Industry labels are inferred account-level classifications, with manual and machine-assisted sources. They are not a verified census of advertisers' product categories.
Medians, currencies and publication checks
The headline is the median of individual US / UK CPM ratios from the large matched sample. Every account contributes one ratio, regardless of its spend. The broader country and industry tables instead show medians across the eligible accounts in each separate population.
Monetary benchmark tables use the repository's fixed currency-to-USD estimates, not historical daily exchange rates. The same-account CPM ratios use one account currency on both sides, so that conversion factor cancels out.
We publish a cohort metric only with a minimum contributor threshold and no single account above 40% of cohort spend. Matched comparisons must satisfy that concentration check in each country. Industry CPMs in the descriptive table are rounded to two significant figures.
A reproducible bootstrap with 1,000 account-level resamples placed the overall median CPM ratio between approximately 1.70× and 1.87×. This is an exploratory interval for the sampled median, not a prediction interval for a new advertiser.
A check using older, unchanged ad-set records
As a sensitivity check, we repeated the paired calculation using only ad sets whose latest recorded update was before the observation window began, with the same country-level spend and impression floors.
That left a matched subsample and a median CPM ratio of approximately 1.80×. The direction of the result remained similar.
This narrower check does not supply delivered-country data or eliminate all historical targeting uncertainty. It also changes the subset of ad sets being compared.
What this analysis cannot establish
We cannot attribute the gap specifically to competition, audience quality, placement mix, creative fit or any other single cause. For background on the platform's mechanics, see Meta's ad auction overview.
Latest targeting settings can misclassify historical activity if an ad set changed during or after the window. Matching accounts does not match products, creatives, bids, optimisation goals, attribution or customer mix. A four-week sample cannot establish a permanent UK-to-US price relationship or seasonal pattern.
We did not measure incremental customer acquisition, contribution profit or lifetime value. The worked GBP examples are labelled assumptions and arithmetic, not observed advertiser outcomes.
Frequently asked questions
Are Meta ads more expensive in the US than the UK?
In this large matched sample, US-targeted Meta Sales activity had a median CPM 76% higher than UK-targeted activity. That supports a higher impression-cost expectation as context for a test, but it does not establish the result for every advertiser or the cost of acquiring a customer.
What does CPM mean in Facebook advertising?
CPM is the cost per 1,000 impressions: spend divided by impressions, multiplied by 1,000. It measures the price of ad exposure. It does not measure unique reach, link-click quality, purchase conversion or profit.
What is a good US Meta CPM for a UK brand?
There is no single figure supported for every brand. In our separate US-targeted Sales industry cohorts, median CPMs ranged from approximately $29 for Apparel & Accessories to $50 for Health & Wellness among the examples shown. The comparison needs the country, objective, category, time window and outcome economics beside it.
Will my US CPA be 76% higher?
The CPM finding does not establish that. Our matched link CPC premium was approximately 53%, and we did not establish a comparable purchase CPA premium in this analysis. Use your own conversion and margin data to assess acquisition economics.
Is the US always the most expensive market?
This study compares eligible US- and UK-targeted activity in one AdManage sample. It cannot rank every country or establish that either market is always more expensive.
Build the expansion test around measurable outcomes
Use the UK-to-US CPM comparison to set context, document the assumptions behind your test, and avoid judging US impression costs against an unexplained UK average.
AdManage helps teams launch and manage their country-specific campaigns in one workflow. Explore AdManage when you are ready to organise your next expansion test.
For the impression-to-click step, see our UK versus US Meta CTR analysis, including five industry comparisons and worked traffic-cost examples.