Paste your video view counts to get your average (mean) and median views per video. Compare posts at the same age, such as seven days after posting, and leave out paid promotion.
0/100 videos
One per line, or separated by spaces. Counts as TikTok shows them work too, like 1.2K or 3M, though exact numbers give a more precise result.
Results
Average views (mean)
—
Median views
—
Paste view counts above, or try the example, to see total, lowest and highest views and a chart of each video.
Average TikTok views = total views across your selected posts ÷ number of posts. Paste counts into the calculator above to get both the mean and median. Compare posts at the same age and keep paid promotion separate. The median helps show when one viral post is lifting your average.
For external context, Metricool’s 2026 research reports an average of about 32,895 views per video in its sample. This is a sample mean, not the typical result for every TikTok account, and viral posts can pull it upward.
Understanding what counts as "normal" helps creators and advertisers set realistic expectations and identify when content truly overperforms. But on TikTok, average is complicated. The platform doesn't show content primarily to your followers like Instagram or Facebook. Instead, the For You Page throws your video to strangers based on what the algorithm thinks they'll enjoy.
This guide explains how to find your own average, read sample benchmarks and judge results by account size and goals. Keep organic posts and paid promotion separate, and use watch time, engagement and business outcomes alongside views.
Average TikTok Views: Sample Data and Your Own Baseline
Metricool’s 2026 study methodology covers 2,314,756 posts from more than 92,000 accounts, comparing January–February 2025 with January–February 2026. It is a study sample, not a census of all TikTok users. Use the benchmark below as context, not a performance target.
Measure
Value or method
How to interpret it
2026 sample mean: video
About 32,895 views
Metricool’s study sample; not a platform-wide median
Personal-account baseline
Your recent comparable posts
Match topic, format and post age
Business-account baseline
Your recent comparable posts
Separate paid promotion from organic distribution
Small-account comparison
Average views ÷ followers
A ratio, not unique follower reach
Large-account comparison
Use a similar account-size cohort
Do not assume a fixed share of followers watches
Engagement rate
Define numerator and denominator
Keep the same definition between reports
Median views
Middle value after sorting post views
Useful alongside a mean when one post goes viral
Your recent average
Total views ÷ number of selected posts
Compare posts after the same elapsed time
A mean alone does not tell you what the typical post achieved. Report the sample, dates, account sizes and median where available; do not invent a median from the mean.
If your videos get 2,000–5,000 views, compare that with your own recent posts before judging the result. A broad study average cannot tell you whether your individual account is underperforming.
TikTok Views by Follower Count: A Separate Brand-Post Sample
Sup’s September 2026 benchmark reports the following medians of category medians for creator posts featuring brands. These are not all-account TikTok averages and should not be merged with Metricool’s mean above.
Creator follower tier
Posts in the sample
Median of category medians
Under 10,000
539
800 views
10,000–100,000
968
1,793 views
100,000–500,000
505
15,800 views
500,000–1 million
126
27,650 views
Over 1 million
141
87,875 views
The source excludes category cells with fewer than five posts and dates the benchmark to 10 September 2026. Different categories, account sizes and branded-post mixes can change results. Use these figures as one comparison, not a guaranteed floor for a sponsored post.
Now let's break down what these numbers actually mean for your content.
How to See Your Average Views on TikTok
Open Profile → Menu → TikTok Studio → Analytics to inspect content performance. TikTok’s creator tools help page explains the available views; menus and access can vary. Then select comparable posts for the calculation.
Manual method: record views for your last 10–20 comparable videos at a fixed age, such as seven days after publication. Add the views and divide by the number of videos. Also calculate the median so a viral outlier does not dominate your interpretation.
Worked example: 1,200, 800, 3,400, 600, 2,100, 900, 5,000, 700, 1,500 and 1,800 views total 18,000 across 10 videos. The mean is 1,800. Sorting the values gives a median of 1,350. Both calculations describe this example sample, not a forecast for your next video.
You do not need to switch to the retired Pro account type to calculate an average. Use the main app’s creator tools or your post counts. Before comparing reports, check how TikTok view metrics differ, especially when ads are involved.
Prefer to skip the math? Free third-party average-views calculators let you paste a public username and get an estimate pulled from recent posts. They're handy for checking competitors too, though they only see public data.
Method
Best For
What You Get
Manual post sample
Any creator
A reproducible mean and median for selected posts
TikTok Studio
Content-level performance
Use the available date range and metric definition
Third-party calculator
Quick checks and competitors
Estimated public average
Once you have your number, the benchmarks above tell you where you stand. For advertisers running dozens of creatives at once, averaging by hand stops scaling, which is where reporting that consolidates every TikTok ad account earns its keep.
Why Average TikTok Views Don't Tell the Whole Story
Calculating an average is simple math. Interpreting what it means for your content strategy is not.
TikTok's For You Page fundamentally changed social media distribution. Your followers might never see your video, while complete strangers across the world do. This creates a massively uneven distribution where typical outcomes are hard to define.
Most Videos Get Far Fewer Views Than Reported Averages
A large benchmark sample mixes accounts with different audiences, posting histories and content. It cannot establish the normal view count for a new account without a comparable subgroup.
A post with a few hundred views may be ordinary for one account and weak for another. Use a consistent sample from your own account before drawing conclusions.
How Viral Videos Skew the Platform Averages
A single highly viewed post can change the mean substantially. Illustrative example: nine posts with 1,000 views and one with 91,000 produce a 10,000-view mean, while the median remains 1,000.
In that example, the median describes the middle post and the mean describes total views spread across posts. Both are correct; they answer different questions.
Content Quality Matters More Than Follower Count on TikTok
On TikTok, a creator with 100 followers might get 10,000 views if the algorithm picks it up. Another creator with 100,000 followers might only get 5,000 views on a mediocre post. This simply doesn't happen as much on platforms like Instagram.
TikTok emphasizes content relevance over creator clout. Your 500-view video might be perfectly average for your situation, even though it sounds low compared to platform stats.
The real question isn't "How do I compare to the overall average?" It's "How do I compare to similar accounts, and how do I beat my own benchmarks?"
How Many Views Should You Get Based on Follower Count?
Views divided by follower count can help normalise results across account sizes. It does not measure the percentage of followers reached: views may include non-followers or repeat viewing, while reach concerns distinct people.
Use a study with a matching follower-size band, or build an internal cohort. The following examples show how to interpret the ratio; they are not measured TikTok benchmarks.
What Are Good TikTok Views for Accounts Under 5K Followers?
For a small account, compare recent post views with both follower count and your own baseline. Avoid treating a single views-per-follower percentage as a universal target.
Illustrative example: 2,000 followers and 860 views gives 43 views per 100 followers. That does not mean 43% of your followers watched. If the same account’s recent median is 500 views, 860 is above that baseline.
Small accounts have an advantage: their followers are more engaged, and TikTok aggressively tests new content in the FYP. You don't need a massive following to get solid reach. This is where scrappy creators can compete with established brands.
Average TikTok Views for 5K-50K Follower Accounts
For accounts with 5,000–50,000 followers, keep the content type and post age consistent when comparing results. A larger follower count does not guarantee a proportionate increase in views.
Illustrative example: 20,000 followers and 4,000 views gives a views-to-followers ratio of 20%. Compare with your own median and similar content; do not label the ratio unique audience reach.
This is where consistency matters most. You have enough reach to test different content types and identify patterns in what works, similar to how AdManage's bulk testing approach helps advertisers systematically identify winning creative patterns. Volume creates data, data reveals patterns, patterns drive strategy.
How Many Views Should Large TikTok Accounts Get (100K+ Followers)?
For accounts with 100,000 or more followers, absolute views and views relative to follower count answer different questions. Use a comparable cohort rather than an assumed platform-wide percentage.
Illustrative example: 500,000 followers and 20,000 views gives four views per 100 followers. Without viewer-level data, that does not tell you how many followers actually saw the post.
The big account paradox: Large accounts face saturation. Their followers also follow many other creators, and the algorithm shows each video to a smaller percentage of any given audience. To overcome this, big creators need either extremely consistent quality or occasional viral hits.
What Does It Mean When Views Exceed Your Follower Count?
Views above follower count can reflect distribution to non-followers, repeat viewing or promotion. Check the traffic sources and unique-viewer metrics available to you before interpreting it as broader reach.
For example, Sony's TikTok (2.7M followers) had a video hit 20M views (roughly 7.5x their followers). For a micro-creator with 1,000 followers, getting 10,000 views is similarly impressive performance. Viral is relative to your baseline.
This is where AdManage becomes valuable for advertisers. When you're running hundreds of TikTok ad variations, you need to know immediately when one breaks through. AdManage's Slack notification system alerts you the moment an ad exceeds your performance thresholds, so you can increase budget and capitalize on momentum before the trend fades.
Personal vs Business TikTok Accounts: Which Gets More Views?
Personal and Business account samples may have different content, audiences and promotion. Compare like-for-like samples before treating a difference in average views as an effect of account type.
Account Type
Average Views
Performance Difference
Personal accounts
Use comparable organic posts
No universal average established here
Business accounts
Separate organic and promoted posts
Account type alone does not establish a causal difference
A difference between account samples would not prove that switching account type caused the result. Audience, content, format and promotion can all differ.
How Content and Audience Affect Account Comparisons
TikTok's audience gravitates toward authentic, entertainment-focused content. Personal creators (influencers, comedians, everyday people) produce the type of videos that drive high engagement and algorithmic promotion.
Business accounts often have promotional angles or niche industry content that limits organic spread. A video about your company's new product line might be valuable for your 5,000 followers, but it's far less likely to break out to millions via the FYP.
What Average TikTok Views Should Business Accounts Expect?
For a business account, compare similar posts at the same age, separate paid views and use a matching follower-size cohort. A 10,000-view post can be strong or weak depending on that baseline; this guide does not establish one universal business-account average.
That said, brands that embrace creator-style content (behind-the-scenes, humor, trending audio) can close this gap. Some business accounts perform like personal creators by prioritizing entertainment value over pure promotion.
How to Get More Views on TikTok Ads vs Organic Posts
Business accounts that rely purely on organic reach face an uphill battle. This is exactly why tools like AdManage exist. Instead of hoping for organic viral hits, you can systematically test hundreds of ad creative variations, identify winners quickly, and scale them with paid distribution.
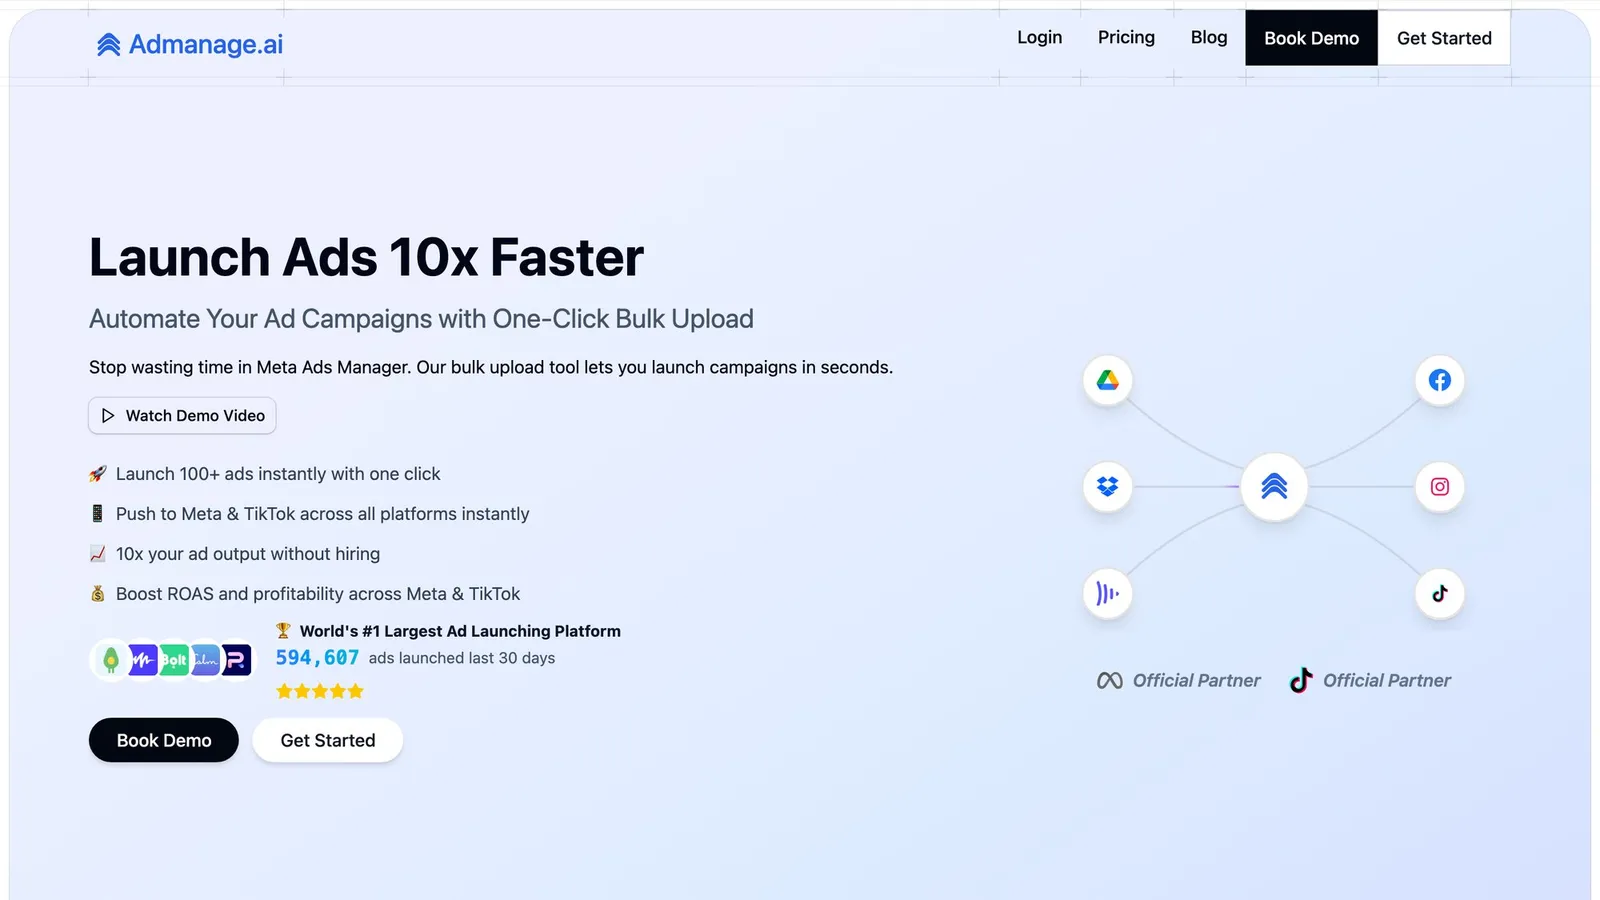
AdManage helps businesses launch bulk ad campaigns across TikTok (and Meta) with structured naming, UTM tracking, and Post ID preservation. When you find a winning creative that's getting above-average views at a low cost, you can quickly spin up variations and test new angles while maintaining social proof from the original post.
The business vs. personal gap matters less when you have systematic creative testing and the ability to amplify what works.
What Is the Average Like-to-View Ratio on TikTok?
Your like-to-view ratio is simply the share of viewers who tapped like: total likes divided by total views, written as a percentage. If a video gets 10,000 views and 350 likes, that's a 3.5% like-to-view ratio.
TikTok's overall engagement rate (likes, comments, and shares combined) sits around 3-4%, and likes make up the bulk of that. Here's the quick read on total engagement rate benchmarks:
Total Engagement Rate (Likes, Comments, and Shares Combined)
What It Signals
Under ~2%
Views may be passive or paid; the hook isn't landing
~3-4%
Right around the platform average
6%+
Strong content the algorithm is likely to push further
Your like-to-view ratio on its own will usually sit a little below these numbers, since likes are only part of total engagement.
To find your own, open any video's stats, divide likes by views, and multiply by 100. Track it across your last 10 posts rather than judging a single video, since one dud or one breakout will distort the picture.
What Is a Good TikTok Engagement Rate? (Views vs Interactions)
Views alone don't tell you if content worked. Engagement rate measures the percentage of viewers who actually interacted with your video.
TikTok's average engagement rate sits around 3-4%. That means out of 100 views, roughly 3-4 result in a like, comment, or share. This is actually one of the highest engagement rates of any social platform, showing TikTok's audience is highly interactive.
How to Calculate TikTok Engagement Rate from Views
~4% = average performanceIf you get 10,000 views and around 400 total engagements (likes + comments + shares), you're hitting the baseline. This is respectable, though not remarkable.
6%+ = strong contentResearch shows top-performing brands achieve 6% or higher engagement rates. If you're getting 8-10+ engagements per 100 views, your content resonated deeply. The algorithm notices this and will likely push your future videos harder.
Under 2% = concerningAbout 22% of brands average below 2% engagement. This often indicates views came from paid promotion without compelling content, or the video appeared in FYPs but didn't hook viewers.
You can inflate view counts with ads or clickbait, but if people aren't engaging, those views have limited value. The algorithm prioritizes content that generates interaction, so purely passive views won't sustain reach.
Why Comments and Shares Matter More Than View Count
Average TikToks get roughly ~19 comments and ~58 shares. If your videos consistently get dozens or hundreds of comments, that's a strong signal of engagement (and likely helps your future content rank better).
Shares are especially valuable. High share counts mean people found your content worth passing along, which often leads to exponential view growth. Even a video with modest views can be considered successful if the engagement rate is high. It means you hit a nerve with your audience.
How to Track Engagement Rate for TikTok Ad Performance
For paid campaigns, engagement rate is critical. A TikTok ad with 50,000 views but only 0.5% engagement probably burned budget on impressions that didn't drive action. Compare that to an ad with 5,000 views and 8% engagement. The latter has 10x fewer views but likely generated more actual results (clicks, conversions, brand consideration).
This is another area where AdManage helps. By testing hundreds of creative variations, you quickly identify which ads drive both volume and engagement. The platform's reporting dashboards let you sort by engagement rate, not just view count, so you can allocate budget to truly high-performing creatives.
When you combine bulk launching with performance monitoring, you turn TikTok advertising into a systematic testing machine rather than a guessing game.
How Many Views Is Considered Viral on TikTok in 2026?
Everyone wants to know: when does a TikTok cross from "doing well" to "viral"?
Marketing experts generally use these thresholds:
1 million+ views within a week is the common benchmark for calling a video viral. It means your content broke out of normal reach and hit trending algorithm waves. Plenty of small creators achieve this occasionally, often by participating in trends or challenges.
5-10 million+ views represents blockbuster virality. These become cultural moments, get written about in media, and spawn countless duets. They're rare but not impossible.
Any video exceeding 5-10x your follower count could be considered viral relative to your size. If you have 10,000 followers and hit 50,000+ views, that video performed exceptionally. It reached far beyond your base audience.
Is TikTok Virality Random or Strategic?
TikTok has democratized virality. You don't need an existing fan base. Creative content can get picked up by the FYP and hit viral numbers even from a brand-new account. That's why average view counts are so volatile.
In contrast, viral videos on YouTube usually come from established channels. On TikTok, the app itself is the virality engine.
What Are Realistic View Expectations for Consistent Posting?
Build your normal range from recent comparable posts. Do not assume that 10–30% of followers watched: a view count is not unique follower reach, and distribution varies from post to post.
The more you post high-quality content, the better your odds of catching lightning in a bottle. It's partly a volume game. Brands and creators who succeed on TikTok typically post multiple times per week, giving the algorithm many chances to promote their content.
When running paid campaigns, you're essentially buying more "lottery tickets" by testing many variations. AdManage makes this affordable by reducing the time and cost of launching campaigns. Instead of manually creating hundreds of ads, you bulk-launch with standardized naming and tracking, then let the platform identify winners.
How AdManage Helps You Get Above-Average TikTok Ad Performance
Speaking of systematic creative testing, let's talk about how modern ad operations tools help brands move beyond hoping for viral hits.
If you're running TikTok ads (or organic content at scale), you face a bottleneck: launching and managing hundreds or thousands of creative variations is incredibly time-consuming. Most teams spend hours configuring campaigns manually in TikTok Ads Manager, dealing with inconsistent naming conventions, UTM errors, and losing social proof when they scale winning ads.
AdManage automates the heavy lifting of bulk ad launches, allowing you to test hundreds of TikTok creative variations without burning out your team on manual campaign setup.
Time-savingscalculators use assumptions rather than measuring every advertiser's labor. For illustration, 1,000 ads at 10 minutes of manual setup each represent 166.7 hours; the time actually saved depends on the work your team still performs. Use current calculator inputs, your own timings and labor cost before judging a subscription's value.
How to Preserve View Counts When Scaling TikTok Ads
One clever feature: AdManage supports Post ID preservation for TikTok ads. When you scale a winning organic TikTok post into an ad, all the engagement (views, likes, comments) stays on the original post rather than splitting across separate ad units.
This is huge for brands. If your organic post already has 10,000 views and 500 likes, and you run it as an ad that generates another 50,000 views, the post now shows 60,000 views publicly. That social proof makes the content look more trustworthy and can drive additional organic reach. People are naturally drawn to content with high view counts.
Compare this to standard ads where paid views don't accumulate on your profile. With Post ID preservation, every paid view contributes to the visible success of your content.
How to Get Instant Alerts for High-Performing TikTok Ads
Here's where it gets interesting for performance marketers: AdManage offers Slack notifications for top-performing creatives. You can set thresholds (like cost-per-view below a certain amount, or engagement rate above a target) and get instant alerts when an ad crosses those benchmarks.
This real-time feedback is invaluable. If a TikTok ad suddenly hits your "viral" threshold (maybe it's getting 5x your normal view rate at half the usual cost), you know immediately. You can increase budget, create variations, or analyze what made it work before the trend fades.
Most brands discover their best-performing ads days or weeks later when reviewing reports. By then, the opportunity to capitalize on momentum is often gone. Real-time monitoring turns anomalies into actionable insights.
How to Standardize TikTok Ad Workflows Across Multiple Accounts
For agencies or brands managing multiple TikTok ad accounts (different markets, product lines, or clients), consistency matters. AdManage enforces naming conventions, UTM parameters, and creative enhancement toggles globally across accounts.
This means your team can look at performance data and immediately understand what campaign, market, and creative type any ad belongs to. No more hunting through mis-labeled campaigns or dealing with UTM inconsistencies that break your analytics.
When you're systematically testing hundreds of creatives, this organizational structure is the foundation that makes data analysis possible. You can confidently compare creative A vs. creative B knowing they were launched with identical settings except for the variable you're testing.
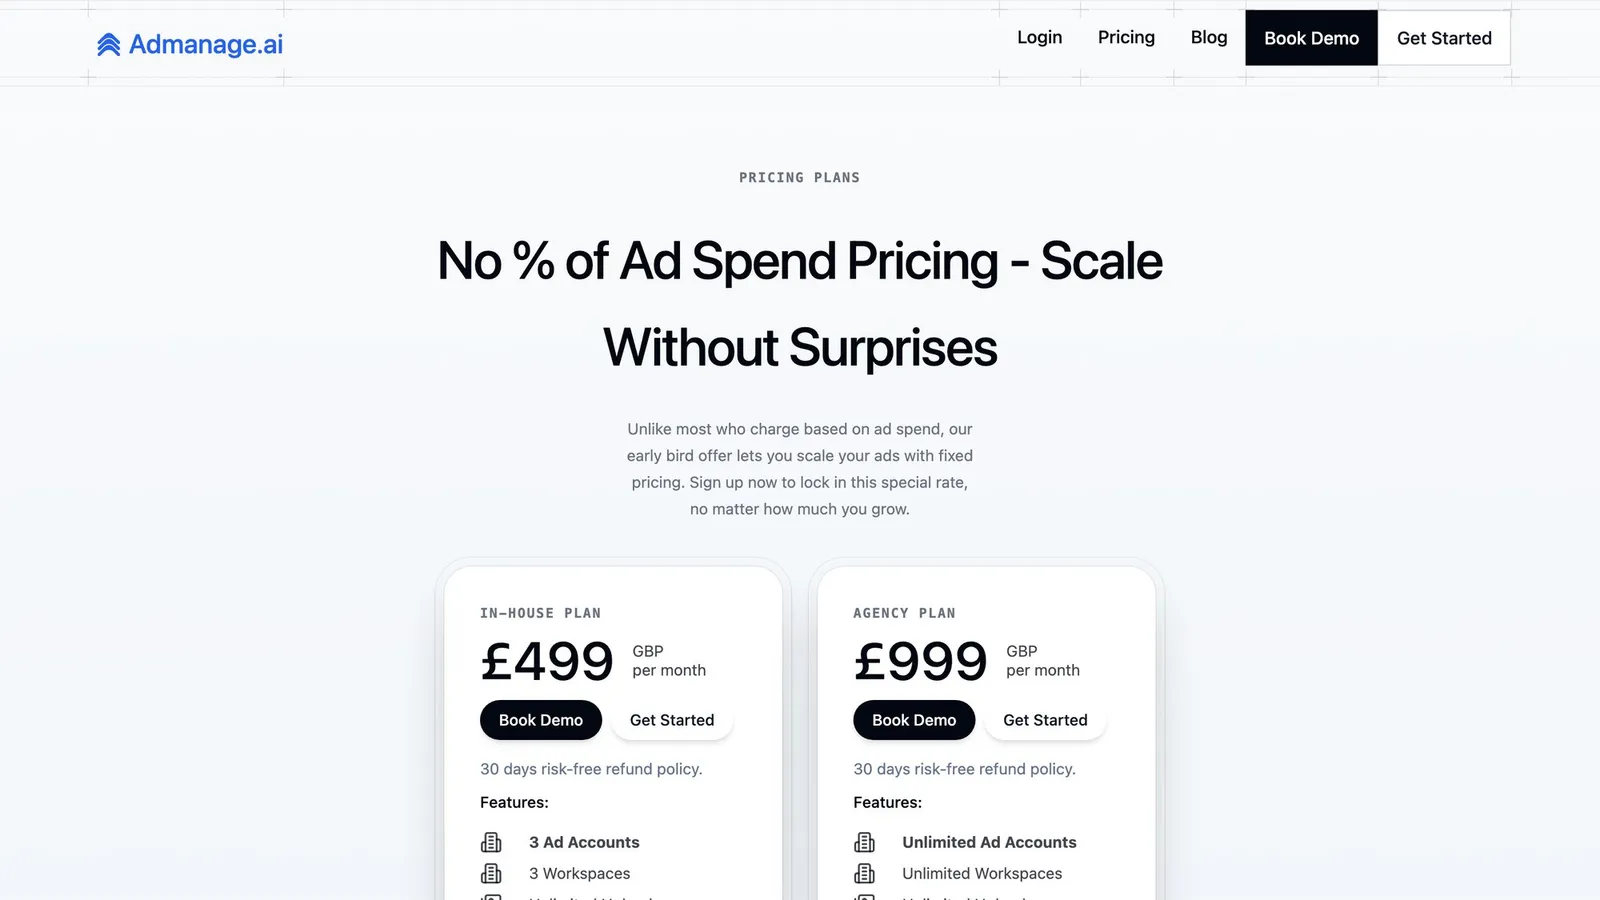
If you're spending 50K or 500K per month on TikTok, you pay the same flat rate. This makes it economical for brands that want to test aggressively without worrying about tool fees scaling with ad spend.
The platform also includes unlimited team members, so your entire marketing and creative team can collaborate without per-seat pricing adding up.
How to Use TikTok View Benchmarks to Improve Performance
Now that you understand the averages and have context on the tools available, how do you actually use this information to improve?
How to Track Your Personal TikTok View Benchmarks
Note your own average views per video over the last month, plus your average engagement rate. This is your baseline. When you beat it, figure out why.
For example, if you normally get 2,000 views and 100 engagements (5% ER), and your latest video hit 5,000 views with 300 engagements (6% ER), that's a win. Look at what made it different. Was it the hook in the first 3 seconds? The trending audio? The topic? The post timing?
Over time, your personal average should climb as you learn what resonates with your audience.
How to Compare Your Views Against Industry Benchmarks
Don't compare yourself to the overall platform average. Instead, find benchmarks for accounts of your size and type.
Industry benchmark data breaks down performance by follower range and industry. If you're a brand with 20,000 followers, compare yourself to similar brands, not to personal creators with millions of followers.
Set a reproducible target, such as improving the median seven-day view count of comparable organic posts. Define engagement rate separately and keep the same numerator and denominator across reports. Views divided by followers is not unique follower reach.
How to Learn from TikTok Videos That Underperform or Go Viral
If a video tanks with far below your normal views, don't panic. But do analyze what might have gone wrong. Was it posted at a bad time? Was the hook weak? Was the topic off-brand?
Conversely, when a video soars, double down. Create follow-up content or variations. TikTok rewards consistency within niches. If you discover that "behind-the-scenes" content performs 3x better than product showcases, shift your mix accordingly.
Which Analytics Tools Track TikTok View Trends?
TikTok's native analytics show follower activity times, top territories, and recent video performance. For power users or advertisers, third-party tools provide cross-platform comparisons and automated tracking.
For advertising specifically, AdManage consolidates performance across all your TikTok ad accounts and campaigns, making it easy to spot trends and outliers.
The key is regular monitoring rather than sporadic checks. If you're serious about TikTok, you should review performance at least weekly to catch momentum early.
TikTok Video Formatting Best Practices to Increase Views
Beyond content strategy, certain tactical choices impact how the algorithm treats your videos. Here are proven formatting tactics:
Video lengthAverage TikTok video length in 2024 was 42.7 seconds, up from earlier years. Longer videos aren't penalized if they maintain engagement. In fact, longer watch time can signal quality to the algorithm.
That said, the first 3 seconds are critical. If viewers scroll past immediately, length doesn't matter. Hook them fast, then deliver value.
Captions and hashtagsTikTok's algorithm can read on-screen text and audio. Including relevant keywords in captions helps your content surface in searches and recommendations. Use 3-5 relevant hashtags, mixing popular and niche tags.
Trending audioVideos using trending sounds get algorithmic boosts. Even if the audio isn't directly related to your content, incorporating it can increase reach. That said, original audio can also work if your content is strong enough.
Call to actionVideos that prompt interaction (asking a question in the caption, encouraging comments, suggesting shares) tend to get higher engagement rates. This signals quality to the algorithm and sustains reach.
Posting consistencyThe algorithm favors accounts that post regularly. If you go weeks without posting, your next video might get lower initial reach. Ideally, post at least 3-4 times per week to maintain momentum.
What to Do When Your TikTok Views Are Below Average
You've read all this data and realize your views are lower than the benchmarks. What now?
First, remember that most accounts perform below the published averages since those are skewed by viral content. You're likely not doing as poorly as you think.
Second, focus on engagement rate over absolute views. If you have modest views but strong engagement (6%+), you're building a loyal audience. Growth will follow.
Third, run experiments methodically:
- Test different content formats (educational, entertaining, behind-the-scenes)
- Try various posting times to find when your audience is most active
- Use trending audio and hashtags to increase discoverability
- Improve your first 3 seconds (the hook determines whether people keep watching)
- Collaborate with other creators to tap into new audiences
- Consider strategic paid promotion to kickstart momentum
For brands, the fastest path to beating averages is usually systematic creative testing at scale. This means launching many variations, not obsessing over any single video. When you test 50-100 creative approaches, a few will naturally outperform. Then you double down on those winners.
This is where tools like AdManage create leverage. The platform makes bulk testing affordable and manageable. You can run more experiments without proportionally increasing headcount or burning out your team on manual campaign setup.
How to Use Paid Ads to Get Above-Average TikTok Views
While organic reach is the holy grail, paid promotion can be a smart accelerator, especially for brands.
What Are TikTok Spark Ads and How Do They Boost Views?
TikTok Spark Ads let you promote an existing organic post as an ad while retaining all engagement on the original video. If your campaign drives 100,000 paid views and 5,000 likes, those metrics stay visible on your profile.
This creates a compounding effect: the post looks viral, which attracts more organic viewers (people gravitate toward high-view-count content). It's a smart way to lift an average video into breakout territory.
Just make sure the content is strong enough to justify the boost. Empty views without engagement won't fool the algorithm or viewers.
How to Use TikTok Ads to Test What Gets Views Organically
Even if you ultimately want organic growth, paid ads can accelerate learning. By running small-budget tests across many creative concepts, you quickly discover what resonates. Then you create more organic content in that style.
Brands using AdManage can launch hundreds of TikTok ad variations, track performance in real-time via Slack alerts, and identify winners before scaling budget. This systematic approach reduces the guesswork and lets data drive creative decisions.
The goal isn't to buy your way to success. It's to use paid distribution to find your creative edge faster, then take advantage of that edge organically.
Illustrative Plan: Compare Your TikTok Views Over Eight Weeks
Suppose a hypothetical brand has 30,000 followers and usually gets 3,000–4,000 views per post. That is 10–13 views per 100 followers, not evidence that 10–13% of followers watched. The example below is a testing plan, not a customer case study or measured result.
Here's a potential action plan:
Week 1-2: Baseline auditReview your last 20 videos. Calculate average views, engagement rate, and watch time. Identify your top 3 performers and bottom 3. Look for patterns. Did behind-the-scenes content outperform product showcases? Did videos under 30 seconds do better than 60-second videos?
Week 3-4: Rapid testingCreate 10 videos testing different formats, hooks, and topics. Post daily. Use TikTok analytics to see which get above your normal reach. Don't worry if some flop. You're gathering data.
Week 5-6: Double down on winnersOnce you identify 2-3 content types that consistently beat your average, create variations. If "day in the life of our team" videos get 2x your normal views, do more of those. Create a series.
Weeks 7–8: If you test paid promotion, record its spend and results separately from the organic baseline. Choose a budget from your own goal and cost assumptions rather than using an arbitrary spend to chase a viral threshold.
Compare the new sample with the original at the same post age. Look for repeated patterns across similar posts before deciding what to test next.
Ongoing: Systematize with toolsIf you're running multiple campaigns or have budget to test aggressively, set up a tool like AdManage to bulk-launch variations. Use Slack alerts to catch outperformers immediately. Allocate more budget to winners while they're still trending.
After eight weeks, calculate the mean and median again and review retention and business outcomes. The process gives you a comparison; it does not guarantee that average views will rise.
Common TikTok Mistakes That Keep Your Views Below Average
Based on the data and best practices, here are traps that keep creators and brands stuck at mediocre view counts:
Inconsistent postingThe algorithm rewards active accounts. Posting once a month won't build momentum. Aim for at least 3-4 videos per week.
Weak first 3 secondsIf viewers scroll past immediately, watch time plummets and the algorithm stops promoting your video. Open with a visual hook or compelling question. Don't waste the intro on branding or slow build-up.
Ignoring trendsTikTok is trend-driven. If you never use trending audio or participate in challenges, you're missing out on algorithmic boosts. Find ways to make trends relevant to your niche.
Overly promotional contentEspecially for business accounts, hard-sell content rarely performs well organically. Lead with entertainment or education, not sales pitches. Save promotion for Spark Ads where you control distribution.
Not testing enough creativeOne video isn't a strategy. You need volume to find what works. Brands that succeed on TikTok test dozens or hundreds of creative variations. If you're launching 1-2 ad campaigns per month, you're not testing fast enough.
No engagement baitVideos that prompt comments or shares get higher engagement rates, which feeds the algorithm. End with a question, controversial take, or call to action that encourages interaction.
Poor use of dataIf you're not tracking what works (and why), you'll keep making the same mistakes. Use analytics tools to identify patterns. When something works, replicate it immediately.
Frequently Asked Questions
What are average TikTok views for a new account with zero followers?
There is no guaranteed beginner view count. Record the first set of comparable posts and build a baseline. A post with 1,000 views may be a useful improvement even if another creator’s average is much higher.
Is 1,000 views on TikTok good?
1,000 views can be good for your account. If your comparable seven-day median is 500, a 1,000-view post is twice that baseline. If it is 5,000, the same post is below it. These are arithmetic examples; retention, audience and goals determine whether those views are valuable.
How many views is considered viral on TikTok in 2026?
There is no universal TikTok definition of “viral” established here. Compare a breakout post with your own median, its time window and traffic sources. A high view-to-follower ratio alone does not tell you how many distinct people watched.
Why do some of my TikToks get no views?
Common reasons include: weak hook in the first 3 seconds (people scroll immediately), posting during low-activity hours, content that doesn't match your audience's interests, or TikTok flagging the video for review (which delays distribution). Also, the algorithm tests every video with a small audience first. If early viewers don't engage, promotion stops.
How do personal TikTok accounts get more views than business accounts?
A Personal account is not guaranteed to outperform a Business account. Compare content strategy and audience before attributing a difference to account type, and choose the account features you need.
What engagement rate should I aim for on TikTok?
Average engagement rate is 3-4% (engagements per view). Anything above 6% is strong. Top-performing content hits 8-10%+. If your engagement rate is below 2%, focus on creating content that prompts interaction (questions, controversial takes, calls to action) rather than passive viewing.
How many followers does the average TikTok user have?
A universal follower average is not useful without a defined population and date. For your own benchmarking, record follower count when each post is published and compare similar accounts or your own history.
How can I tell if my TikTok views are above or below average for my follower count?
Calculate average views divided by follower count, then compare that ratio with your own history and a relevant cohort. Label it a views-to-followers ratio, not reach rate. Use unique-viewer or reach data when you need a count of people.
Should I use TikTok ads to boost my views?
If you're a business, TikTok ads (especially Spark Ads) can be valuable for testing creative and amplifying winners. Start with small budgets to identify what works organically, then scale paid promotion on high-performing content. Tools like AdManage make it easy to test hundreds of variations and track which ads hit above-average performance in real-time.
Final Thoughts: Focus on Your Own Benchmarks
Your own reproducible baseline is more useful than treating a study mean as a target. Keep the sample, post age, paid-versus-organic status and calculation method consistent, then look for patterns worth testing.
Track your personal baseline: views per follower, engagement rate, watch time. When you beat it, analyze why and replicate those wins. When you fall short, learn and adjust.
For brands running TikTok ads at scale, systematic creative testing is the path to consistent above-average performance. Platforms like AdManage give you the infrastructure to launch hundreds of variations, track performance in real-time, and double down on winners before trends fade.
The opportunity on TikTok is that every video has a shot at outperforming the averages if it strikes the right chord. Your next post could be the one that breaks out. Use the benchmarks in this guide to set realistic expectations, but don't let them limit your creative ambition.
After all, every viral video started with zero views. The difference between average and outstanding is often just a few strategic choices and the persistence to keep testing until you find what works.
Ready to stop guessing and start systematically beating your TikTok benchmarks? Check out AdManage's pricing to see how bulk launching and real-time alerts can help you identify and scale your best-performing TikTok ads.
Cedric Yarish is a Meta ads expert, performance marketer and product builder with 10+ years of experience across Photoroom, Nextdoor and MVF. At Photoroom, he led user acquisition with more than $1 million in monthly ad spend and a creative operation producing 400 ads a month across 30 languages.
Today, he leads product and engineering at AdManage, the platform he co-founded with his brother Raphael to help marketers launch, test and manage ads at scale. Meta has quoted him on its developer blog and invited him to speak on its Partner API Panel in New York. His insights on creative testing and advertising automation have also featured in RevenueCat and In Growth We Trust.